Viewability metrics: here’s what you should be looking at
By Asaf Shamly | April 16, 2021

It’s been more than five years since the industry started seeing viewability as a touchstone for all impression-based metrics. It’s only logical – viewability is a metric that helps advertisers understand whether or not their ad was viewed by visitors. An ad that wasn’t viewed won’t really contribute to the campaign’s goal. That’s a consensus. As a result, publishers have since been scrutinized more carefully than before…
They’re increasingly held accountable for delivering a premium ad inventory, meaning they want to deliver high viewability on a maximum number of ads without losing impressions or eroding the user experience in the process.
A better understanding of ad viewability starts by mastering all the metrics associated with viewability. That’s why in this post we’ll detail all the key viewability metrics you need to be looking at. We’ve broken them down below and split them into two major categories: basic viewability metrics and key (often neglected) metrics. We’ve also added some food for thought at the bottom of the article and would love to hear your take on it.
The Alpha and the Omega of measuring ad viewability
Let’s start with the very basics – what is ad viewability? It’s a metric that tells us if an ad was visible on a specific page or website. According to the Media Rating Council (MRC), an ad is considered viewed if half of its pixels were in the active browser tab and in the visitor’s view for at least one consecutive second.
While other viewability metrics have formulas and exact rules for how they’re measured (as you’ll see further below), MRC leaves room for interpretation on how to measure the second.
As a general rule of thumb, it suggests that measurers should track one second as 10x100ms, meaning an ad can be considered viewable if it meets the requirements for 10 consecutive batches of 100 milliseconds. However, different analytics platforms could go for a different approach (5x200ms, for example) which might result in discrepancies and is something to keep in mind.
Viewability rate – This refers to ads that were viewable to visitors in relation to all of the measurable impressions. To calculate the viewability rate of your ad inventory, use this formula:
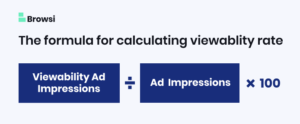
(Viewable Ad Impressions ÷ Ad Impressions) x 100.
Don’t forget that the viewability rate differs and depends on countless variables, including the type of ad, its size and position, but also the ad layout, geographic distribution, cultural differences among visitors, and many, many more. The industry golden standard at the moment is 70%, meaning seven out of 10 ads need to be viewable in order to hit standard direct campaign goals.
Measurable impression – Just because an ad is served, that doesn’t mean it can be measured for viewability. There are certain scenarios, such as using cross-domain iFrames for example, in which the measurers are blocked from the data needed to measure viewability. That’s why we need a metric such as measurable impressions, where we track the number of impressions that can be measured for viewability, in the first place.
Measurable rate – In short, this is the percentage of total impressions that’s measured for viewability. The formula goes like this:

Measurable rate = Measured Impressions / Impressions
Keep in mind that total impressions include both measurable, as well as non-measurable impressions. This metric is usually used to determine how many times an ad appeared in measurable positions.
Non-measurable impression – This is an impression that was served but whose data couldn’t be captured and, as such, could not be measured. It doesn’t necessarily mean that the ad wasn’t viewed, just that the information about it is lacking.
Non-measurable impression distribution – Refers to the percentage of non-measurable impressions out of the entire ad distribution. Helps you determine the percentage of your ads whose data couldn’t be aggregated.
Viewable impression – An impression that can be considered as “viewed” (50% – one second).
Non-viewable impression – All impressions that cannot be considered “viewed” (either have less than 50% of pixels in view or haven’t been viewed for a straight consecutive second).
Viewable impression distribution – This refers to the percentage of viewable impressions, compared to the entire distribution (including both measurable and non-measurable impressions).
Non-viewable impression distribution – is the percentage of non-viewable ad impressions in relation to all ad impressions.
Viewable CTR – The click-through rate of viewable impressions.
Average viewable CPM – The average CPM of viewable impressions, non-viewable impressions excluded.
Historical viewability score – A metric that tracks the changes in the viewability score over time and across ad positions.
Measurable cost – The cost of all measurable impressions. Excludes ads that were served but whose data couldn’t be captured and thus couldn’t be measured. Don’t confuse non-measurable ads with non-viewable ones.
The Dark Horse of viewability metrics
Image credit Giphy
Measuring for humans – Viewability fraud is real and should not be neglected when considering viewability metrics. Fraudsters will use advanced bots to trigger page opens, even page scrolls and clicks. Fraud detection tools are often insufficient as they are able to guarantee the accuracy for only a small portion of the overall data. Unfortunately, it leaves too much room for manipulation, which is why publishers need a different approach to ensure they’re not being tricked.
If there’s one thing bots still can’t properly mimic – it’s human behavior. Humans will never open a page, scroll through it in a super precise, robotic way, click an ad and move out. They’ll most likely lurk around, scroll up and down, maybe even highlight some text, or click here and there. For your average bot, human behavior is somewhat chaotic and that’s super hard to imitate.
In order to ensure you’re getting honest views, you should measure for human behavior. Besides looking for “chaos”, you should also pay attention to engagement, as actual humans usually have double the user engagement compared to bots.
To conclude – your ad inventory can perform a lot better if you fine-tune your ad calls to behaviors consistent with humans.
Know your metrics, know your worth
When measuring ad viewability, knowing what to look for can significantly improve your bottom line. If you want to make sure you’re being paid your worth, keep these viewability metrics in mind at all times.
And that brings us to our food for thought: What do you do with the viewability metrics you get? How do you optimize your ad viewability? Did you know you could deploy an AI solution to eliminate most of the footwork, boosting your viewability and keeping the UX intact while freeing up significant portions of your time?
It’s now possible to personalize your ad inventory in a quick and seamless manner, optimizing it for viewability while keeping your UX intact. Hit us up if you’d like to learn more.
Latest Articles
-

When Budgets Shrink, Transparency Becomes Power
Today’s media teams aren’t just asked to drive results; they’re asked to defend them. In a market where ad budgets are under the microscope and every dollar must prove its worth, clarity and efficiency win. It’s no longer about spending more — it’s about spending smarter. The brands that can surface waste, double down on what works, and adapt in real time will be the ones that thrive in this new media economy.
View Now -

In Real-Estate and in AdTech – Location is (Almost) Everything
You can have the best ad in the world - high-performing creative, long time in view, shown to an engaged user. But if it’s squeezed between seven other ads on a cluttered page? It’s not going to land. That’s the part we don’t talk about enough. The environment. The layout. The density. The visual noise around the impression. Let’s talk about two under appreciated KPIs that shape that environment.
View Now -

The Open Web Just Got More Transparent (Sort Of)
OpenSincera is a bold step toward greater transparency in MarTech. This free API gives open access to inventory data across the web, signaling a shift toward more informed planning and smarter decision-making. But how far does this visibility really go - and what comes next for advertisers, publishers, and the open web?
View Now