How personalized ad layouts improve performance and user experience
In order to demonstrate the correlation between personalized ad layouts and uplifts in KPIs, we observed the most viewed articles of one of the US’s leading publishers for an entire day in June 2021.
All metrics were improved across the board.
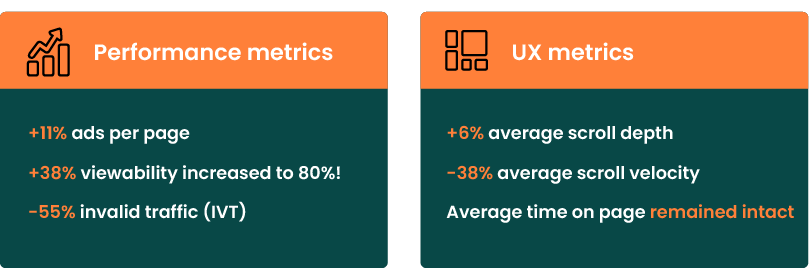
Performance metrics
- +11% ads per page
- +38% viewability – increased to 80%!
- -55% invalid traffic (IVT)
UX metrics
- +6% average scroll depth
- -38% average scroll velocity
- Average time on page remained intact
Performance Evaluation
| Ads per Page | Viewability | Invalid Traffic | |
| Benchmark | 2.00 | 58% | 1.80% |
| Personalized ad Layout | 2.21 | 80% | 0.81% |
| Difference | +11% | +38% | -55% |
UX Evaluation
| Pages per Session | Avg. Scroll Depth | Avg. Scroll Velocity (folds/sec) | Avg. Time on Page (sec) | |
| Benchmark | 1.38 | 48% | 0.13 | 81.16 |
| Personalized ad Layout | 1.38 | 51% | 0.08 | 81.52 |
| Difference | 0% | +6% | -38% | 0% |
Behind the curtain, here’s what went down
By unleashing AI behind the publisher’s digital real estate, we were able to personalize in real-time the ad layout for each individual visitor.
Viewability
Before Browsi created user behaviors-based ad positions for the publisher, the ad positions were primarily median, ranging between 1000 and 8000 pixels.
Consequently, the publisher’s average viewability rate was 58%.
After personalizing each ad placement per user, optimal positions were allocated on each page.
The result: viewability was up by 38% to an impressive 80%
Impressions/Page Distribution
Before Browsi, the amount of impressions was the same for each article, ranging between 1 and 3.
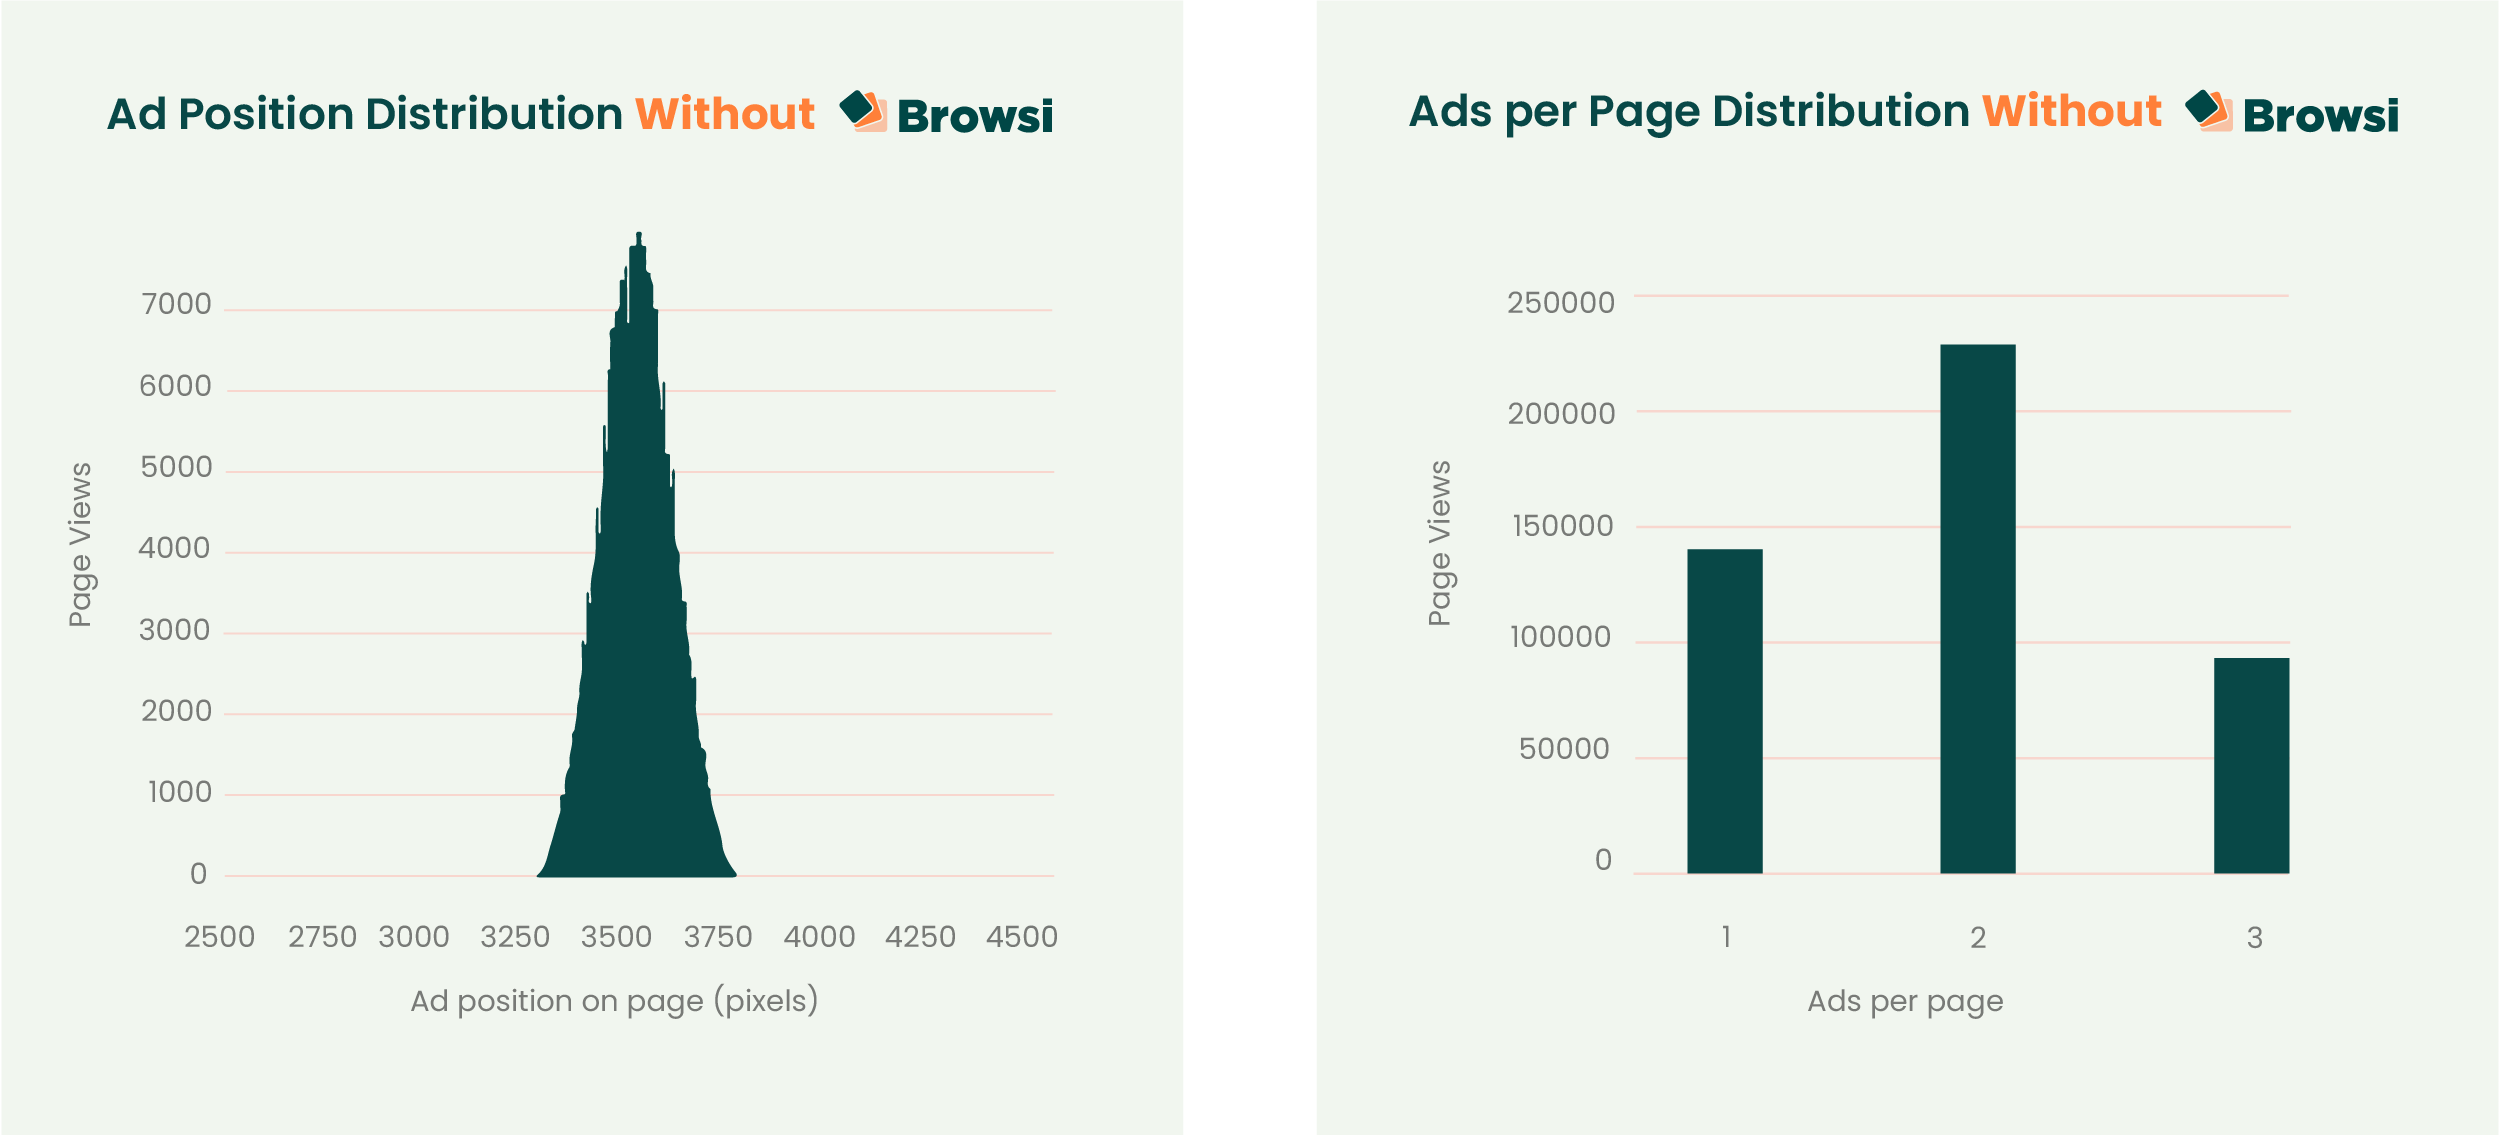
Consequently, the publisher’s average ads per page was 2, and all ads were located at the exact same places.
After Browsi’s AI inferred from user behaviors whether a specific position should be utilized or not, a different amount of impressions were implemented for each page and placed in custom locations. This enabled maintaining the optimal viewability/ad density and quantity ratio for every page.
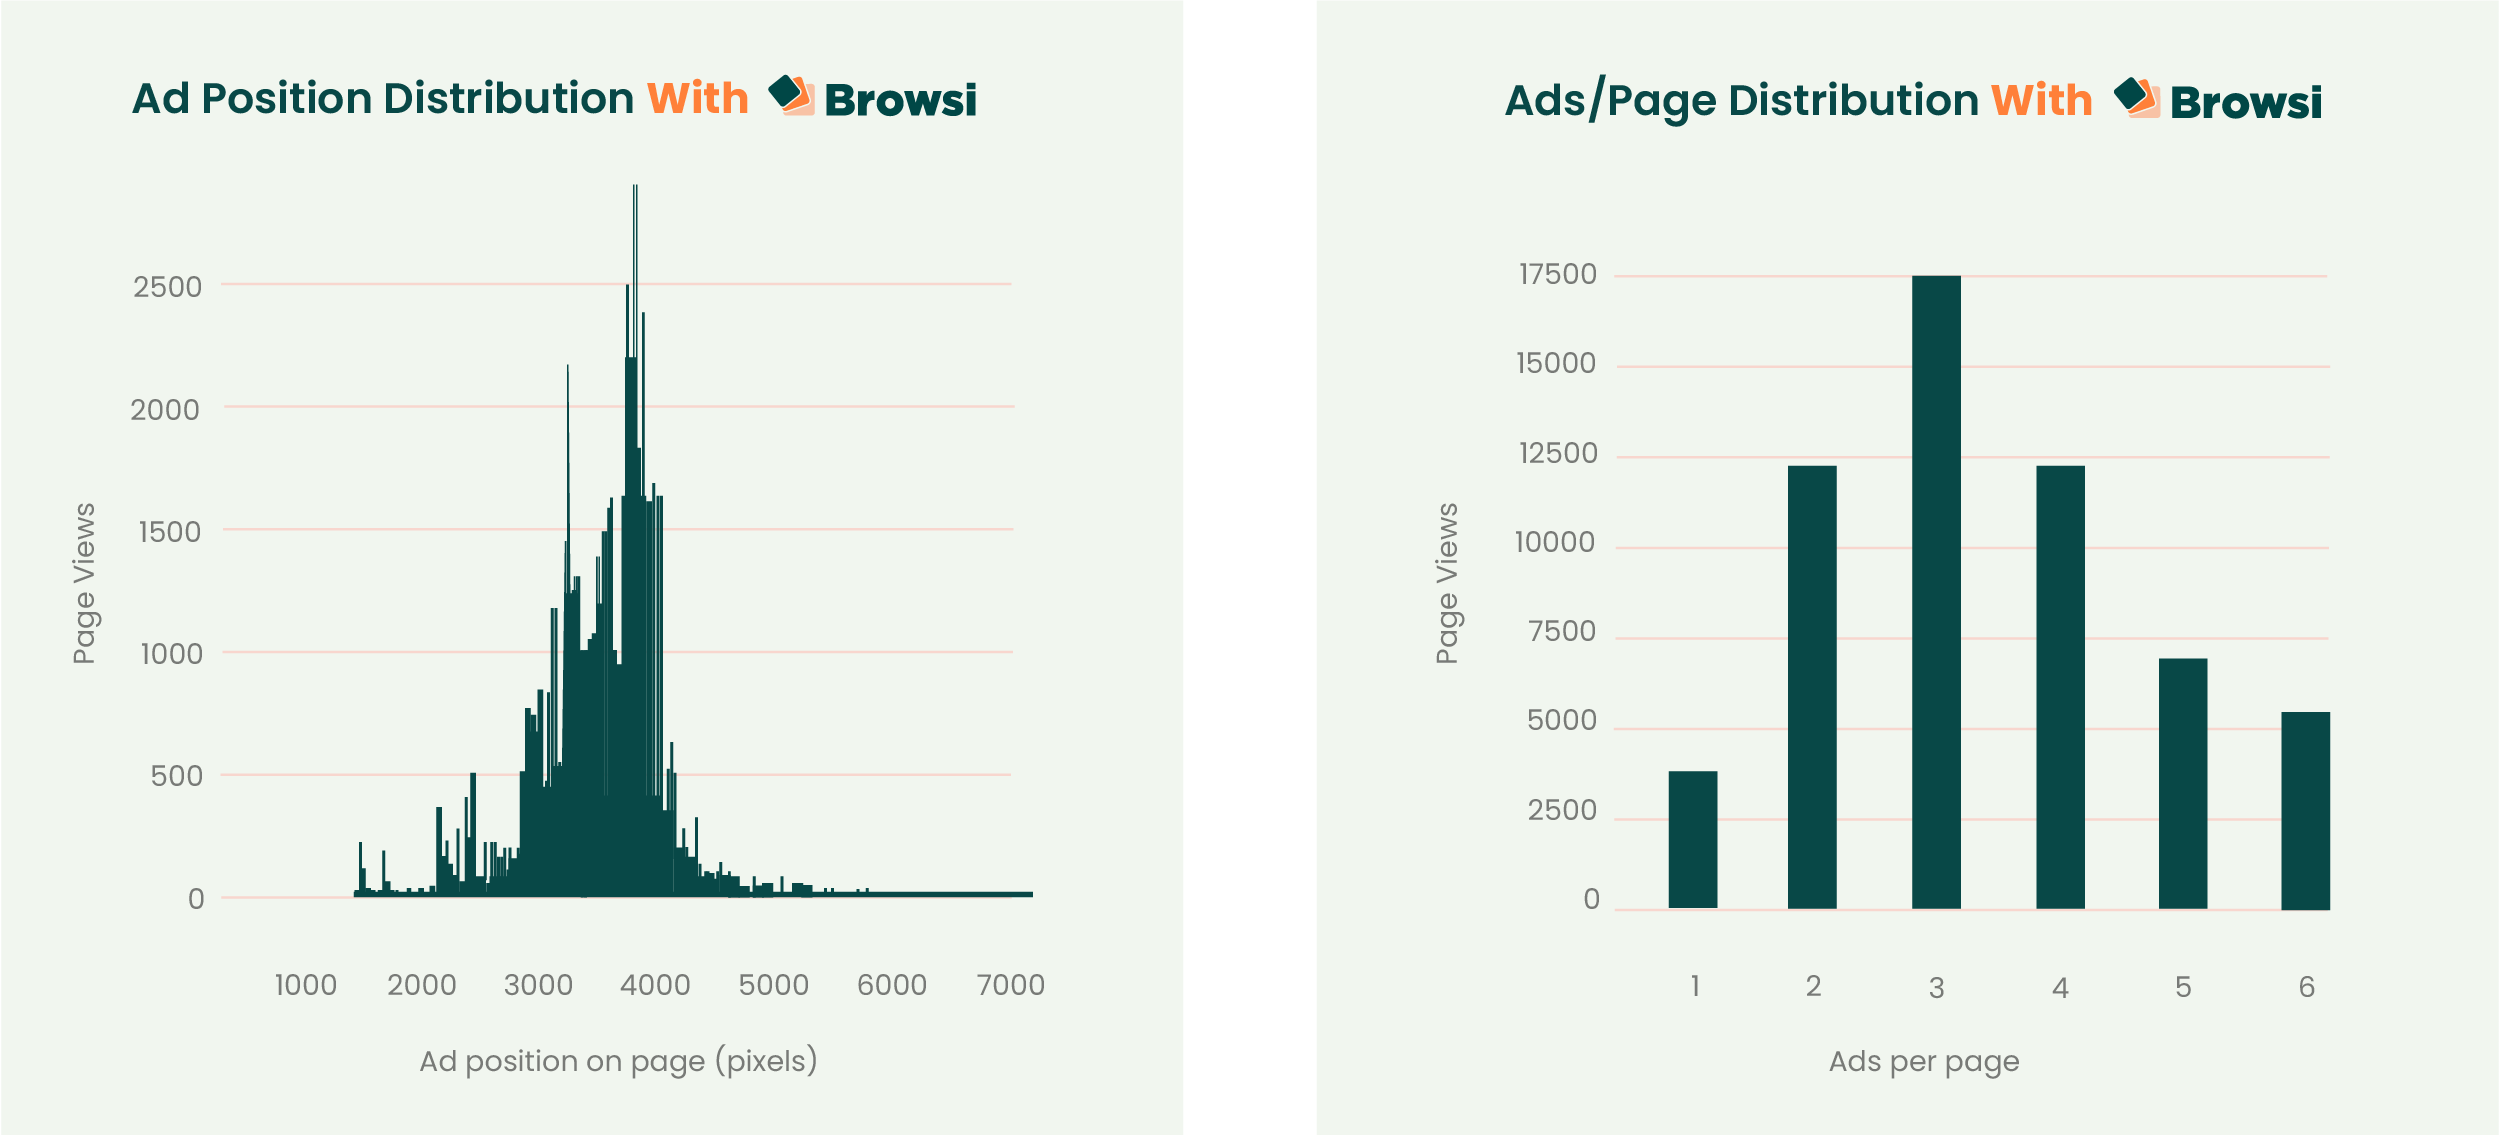
The result: Ads per page were up by 11% to 2.21
The bottom line
With the help of Browsi, the publisher was able to optimize key KPIs while improving the user experience.
Pretty amazing right?
What about you? Still working manually? We invite you to schedule a demo and evaluate how we can help you step up your game.