A rockstar publisher’s guide to better ad viewability
By Asaf Shamly | February 22, 2021

Advertisers’ viewability expectations are rapidly growing, raising the industry bar. As a publisher, you want to deliver high viewability while maximizing the number of ads shown per page AND not lose impressions.
The struggle is real.
source: giphy
In this guide, we’ll help you screen noise and navigate what you need to know about ad viewability. We’ll step back to cover the fundamentals of what ad viewability is and why it’s important, cover some basic FAQs, then discuss how to track it via key viewability metrics, review the best practices to increase or improve ad viewability (including predicting viewability), and finally touch on the correlation between viewability and fraud (IVT).
We’ll gradually pick up the pace so feel free to skip parts you already know.
Let’s get to it, there’s a lot of ground to cover!
What exactly is ad viewability and why does it matter?
In 2016, the Interactive Advertising Bureau (IAB) and Media Rating Council (MRC) created a standard definition of ad viewability: at least 50 percent of an ad must be in view for a minimum of one second for display ads. For large ads (242,000 pixels or greater), at least 30 percent of it needs to be in view.
Where does this meet reality? TLDR: expectedly, advertisers want high(est) viewability rates because they translate to better ROI.
Meaning – publishers that don’t optimize their ads for viewability end up wasting impressions to meet advertiser expectations and yield lower revenue.
The formula for calculating your viewability rate is simple:
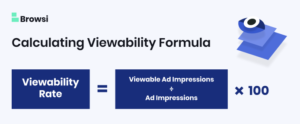
Viewability Rate = (Viewable Ad Impressions ÷ Ad Impressions) x 100.
What does it look like on the playing field? The golden industry benchmark for ad viewability i.e. viewable impressions in advertising campaigns has become around 70 percent. This means seven out of ten ads need to be viewed for one second in order for a publisher to hit campaign goals. Obviously, the higher the percentage, the better. As a result, not hitting 70 percent has become cause for concern or at least – a challenge to overcome.
For example, let’s say a publisher’s sales team sells a brand a campaign for
- 1M impressions
- minimum 70 percent viewability (industry standard)
- a price of $10 CPM
Campaign goal = 1,000,000*70% = 700,000 viewed impressions.
If the publisher ends up with only 50 percent viewable impressions, they’ll need to spend 400k more impressions in order to reach the campaign goal of 700k views.
The publisher will need to serve the campaign longer, or on more content, in order to reach the goal, and waste 400k impressions that they could have sold programmatically or directly to someone else.
The campaign target will be hit, but it will take the publisher longer or require more footwork. Furthermore, CPM will be worth less.
In other words – you’re in a daily war for maximum viewed ad impressions.
And the playfield is rough.
Now that we understand why this is critical, and before we dive into the nitty gritty of measuring and optimizing ad viewability, best practices and emerging solutions, let’s quickly move through a couple of frequently asked questions. These cover a few terms you might have missed along the way, which could fill a few tiny gaps in knowledge:
Do platforms (e.g mobile / desktop) play an important role in ad viewability?
Yes, they do. platforms, in good measure, dictate ad viewability. The mobile web platform, for example, differs quite severely from the desktop one, for two main reasons: screen real estate is smaller, and users usually have shorter attention spans on mobile. That being said, this report argues that mobile app platform ad viewability is nine percent higher compared to anything else (desktop or mobile web), while mobile app display time-in-view surpassed mobile web display time-in-view by 4.6 seconds.
What about display ads vs video ads?
As we previously said, at least half of the display ad needs to be in view for at least a second to be considered viewed. For super large ads – at least a third of it. But what about video ads? While the viewed real-estate remains the same (at least 50 percent of the video needs to be in the visitor’s view), the length changes. A video needs to be in view for at least two seconds for it to be considered viewed.
The terminology conundrum: IAB Standards / MRC Standards
Even though you may come across terms such as IAB viewability standards or MRC viewability standards, it’s important to keep in mind that there aren’t multiple (or conflicting) standards when it comes to viewability.
In order to clear out any possible confusion, do note that the standards that were adopted by the wider community were built jointly by IAB and MRC, and both terms essentially refer to the same thing.
The only difference is that MRC also hands out accreditations. MRC viewability accreditation refers to the accreditation given by the organization to advertising technology platform companies that MRC deems reliable and transparent.
What should I know about programmatic viewability?
It’s a widely known fact that programmatic doesn’t perform as well as direct sold ads, in general and specifically when it comes to viewability. However, publishers are increasingly adopting verification technologies for programmatic transactions, which also help improve programmatic viewability (by verifying the authenticity of the traffic and cross-referencing viewability figures to make sure they match). It is worth mentioning that programmatic viewability is lower as many publishers are allocating the higher performing ad units to direct campaigns.
If you’re not using any verification tools at the moment, a good first step would be to opt for programmatic advertising networks that come with MRC’s viewability accreditation. TAG (Trustworthy Accountability Group) also issues certifications that attest to the transparency and the quality of the network, but MRC would probably suffice.
Those looking for a third-party ad verification tech besides certifications should try any of these companies:
Do note this requires a lot of grunt work that can be severely shrunk, if not completely eliminated from the equation, through the use of advanced tech such as Artificial Intelligence (AI).
Getting practical – measuring ad viewability
Now that we’ve covered what ad viewability is, how it’s defined and why it’s an important metric, you will want to make sure your performance tomorrow will be better than your performance yesterday. Going by the saying we love and live by “what isn’t monitored isn’t managed”, the obvious first step is to take out your colloquial map and compass and understand where you’re located when it comes to your current viewability performance.
Below we’ll go through the ad viewability metrics and submetrics that are important to track, and which tools you can use to calculate your viewability KPIs.
Measuring the current state of affairs
Viewability in itself is a metric, but we can break it down to a couple of sub-metrics which you should measure. Here is a list of key metrics and what they mean:
- Viewable impression – The number of times the impressions fall into the “viewed” category (50 percent – one second).
- Non-viewable impression – All other ad impressions (less than 50 percent in view, less than one second viewed).
- Viewable impression distribution – The percentage of viewable ad impressions, in relation to your entire distribution. This metric includes both measurable and non-measurable impressions.
- Non-viewable impression distribution – The exact opposite of the above: the percentage of non-viewable ad impressions, compared to all ad impressions.
- Viewable CTR – The click-through rate of viewable impressions.
- Average viewable CPM – The average cost of 1,000 viewable impressions. Does not count non-viewable impressions into the price.
- Viewability rate – How many of your measurable impressions were actually viewable to potential customers. Calculated using this formula: (Viewable Ad Impressions ÷ Ad Impressions) x 100. What is a good viewability rate is still up for debate, so make sure you check out our dedicated blog on the matter to learn more.
- Historical viewability score – How the viewability score changed over time, which ad units are showing the highest viewability.
Pro tip:
Ads perform differently based on their size, format, geography and even industry. Make sure to track the above KPIs against these indicators, or any other personal preferences visitors may have.
What viewability monitoring and reporting tools should you use?
The diplomatic, ambiguous answer would be “it depends”, but with only a handful of “serious” players on the field, you really can’t miss that much by going for one of the below mentioned:
- Moat
- Integral Ad Science
- Smart Adserver
- DoubleVerify
- Comscore
- Pixalate
- Browsi (yours truly)
They may differentiate between themselves on a metric or two, but for the most part, they’ll do what they’re designed to do – and do it well.
Publishers can track viewability and its various metrics across different platforms and ad types. You can tackle the problem of ad viewability fraud (more on this later) and in some cases – predict viewability based on historical data (we’ll go more in depth on this later as well, although, as you might imagine, predicting the future based on past events isn’t ideal – there’s a better way).
The best practices for improving ad viewability
At the end of the day, when applying traditional methods, improving your ad viewability comes down to the efforts of your task force and the way you’re able to design your sites and pages. It’s about optimizing from time to time, looking to constantly move the needle.
Here are some of the best practices publishers are applying:
Now do bear in mind that none of the traditional best practices detailed below are bulletproof or ideal. Stay with us, we’ll explain.
UX optimization tactics
- A/B testing placements – Although it’s hard to move the needle with this time-consuming process, it’s a classic tactic among publishers (though it’s slowly but surely losing its superstar status). The idea is to A/B test various ad sizes and placements with a goal of creating a “winning template” and sticking to it. During 2020, we’ve surveyed hundreds of top global publishers and our findings have shown that while this used to be the ultimate viewability optimization practice, it is now only favored by 45.5 percent of publishers.
- Adding more ads to a page – Generally considered the path of least resistance, especially for publishers who haven’t yet hit 70 percent viewability. Relatively quick and easy to implement, but the downside is that it means compromising on revenue or quality/ quantity.
- Using sticky placements – Another quick and simple solution that has its drawbacks. Publishers can achieve higher viewability with sticky placements, but it’s an aggressive move that can potentially antagonize the audience.
- Redesigning the site – Trying to figure out a new design that can help fit more ads within the real estate of the site. The focus here is typically on changes in font sizes, the number of images, and ultimately the number of ads rather than a complete overhaul.
Technology developments
Methods on the technology side of things that publishers frequently do to try and optimize their ads for maximum viewability include:
- Improving site speed – Site speed and viewability rates are proven to be correlated, which is why publishers are constantly optimizing site speed. Our findings show that improving site speed was the number one practice for 2020, with more than half (57.6 percent) of publishers saying it proved most valuable to them. Standard practice includes limiting the number and size of images on site, or ensuring optimal hosting solutions.
- Improving ad load speed – This one is pretty obvious. Publishers usually limit the number of ads per page to 4-5, use asynchronous ad codes, or limit image sizes to speed up ad loading.
- Lazy loading ads – Sounds good in theory, but suboptimal in practice. Usually considered as a last resort, as it means sacrificing impressions (anywhere between 30 – 50 percent). Still, being the second most popular solution out there (57.6 percent of publishers resorting to it) best shows the state of affairs when it comes to viewability optimization.
- Removing demand partners – Removing ad exchanges or programmatic buyers that are outbidding advertisers that require delivering to first, or due to them slowing the site down.
Taking a business approach
At the heart of AdOps footwork typically sit two tactics:
- Compensate by serving additional ads (downside being wasting impressions in the process),
- Move campaigns around to experiment with placements that potentially have higher viewability (downside being a time-consuming, tedious process, and the obvious ad waste).
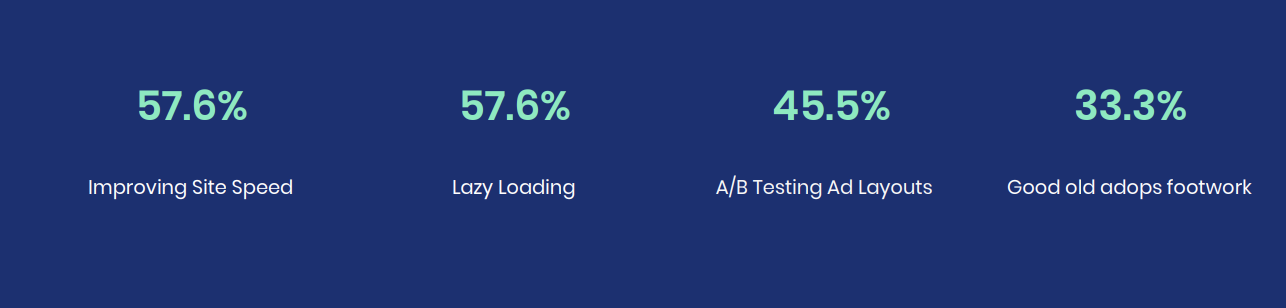 the best practices proving most effective among publishers based on our 2020 survey
Predicting viewability
Publishers will often use various tools and services to predict the viewability based on historical data. They then use that data to allocate campaigns to a few select units. The downside is, given that the pages are consumed differently by different visitors, they will miss out on various opportunities and create ad waste.
On top of this, no matter what set of predictive rules a publisher will create – the second the page is loading it’s a different ball game, and that’s almost impossible to adapt to.
Having said that, it’s better to take a stab at predicting ad viewability than to lose revenue by not predicting at all.
The good news?
This is a field where AI can help, as the tech is able to do a better job predicting viewability in real time. It’s quite the work of art, too, which leads us to the following bonus point:
The innovative approach: Introducing AI
Some publishers have started thinking outside the box and implementing new viewability optimization technologies, to great success. AI can be used to significantly improve viewability by personalizing the ad layout for each individual visitor.
This is done in real time during the milliseconds between a visitor entering a page and the page loading.
When it comes to ad viewability optimization, a good publisher will always remain vigilant. While the practices listed here are well-established in the industry, anything else a publisher comes up with is fair game.
The most important part is to keep an open mind and try to think outside the box as much as possible.
Bonus: How to spot and eliminate viewability fraud
A good publisher will always follow a simple truth: if a metric can be manipulated, it will be manipulated. Viewability, in that sense, is no different, and if not careful, you can end up looking at completely fabricated data. To better understand how fraudsters falsify ad viewability data, we partnered with fraud expert Dr. Augustine Fou. Together with Fou, we went through 966,000 pageviews, 1,805,840 ad requests, and 879,960 impressions on 15 different domains.
The TLDR of that joint effort is that you should not just measure viewability in the sense of whether or not the ad ticks all the boxes (50 percent of it viewed for at least a second, let’s say). Those things can easily be faked with bots.
Instead, you should be measuring for humans, which means understanding if the person viewing the ad actually behaves like a human being. A robot, designed for viewing ads, is going to do just that – open up a site, view the ad (at least half of if, for at least a second, right?), and – leave.
A human will probably linger around a bit, do a little reading, maybe a little clicking or interacting in whatever way the site allows. Our findings have shown that humans have double the user engagement compared to bots.
Being able to measure for humans will give you a much better understanding of your ad inventory. To do that, use tools that allow you to track things like mouse movement, page scrolling or clicks. We wholeheartedly recommend AI technology to leverage real-time engagement metrics.
Concluding with food for thought
Viewability became a currency five years ago. Publishers started trying to optimize their ad layouts and yield through it. It’s a challenging ride, and the manual best practices to optimize for maximum viewability are limited. The first step is to understand the landscape, terminology and KPIs. The next steps require a shift in mindset by accepting the fact that nowadays technology presents a whole new way of addressing the common challenges, posed when optimizing ad inventory for viewability.
If you’re curious to learn how unleashing AI behind your efforts can help you take care of all the decisions that need to happen in real time, end to end, from page load until an ad is shown – hit us up.
Latest Articles
-

How Accurate is Browsi’s Data? Tried and Tested.
Most marketers trust competitive spend data without questioning where the numbers come from. We tested PolarisAI Engine™ against the only benchmark that matters: what advertisers actually reported in their earnings calls. The result was an 87% correlation across five major brands, revealing the difference between data that looks confident and data grounded in reality.
View Now -
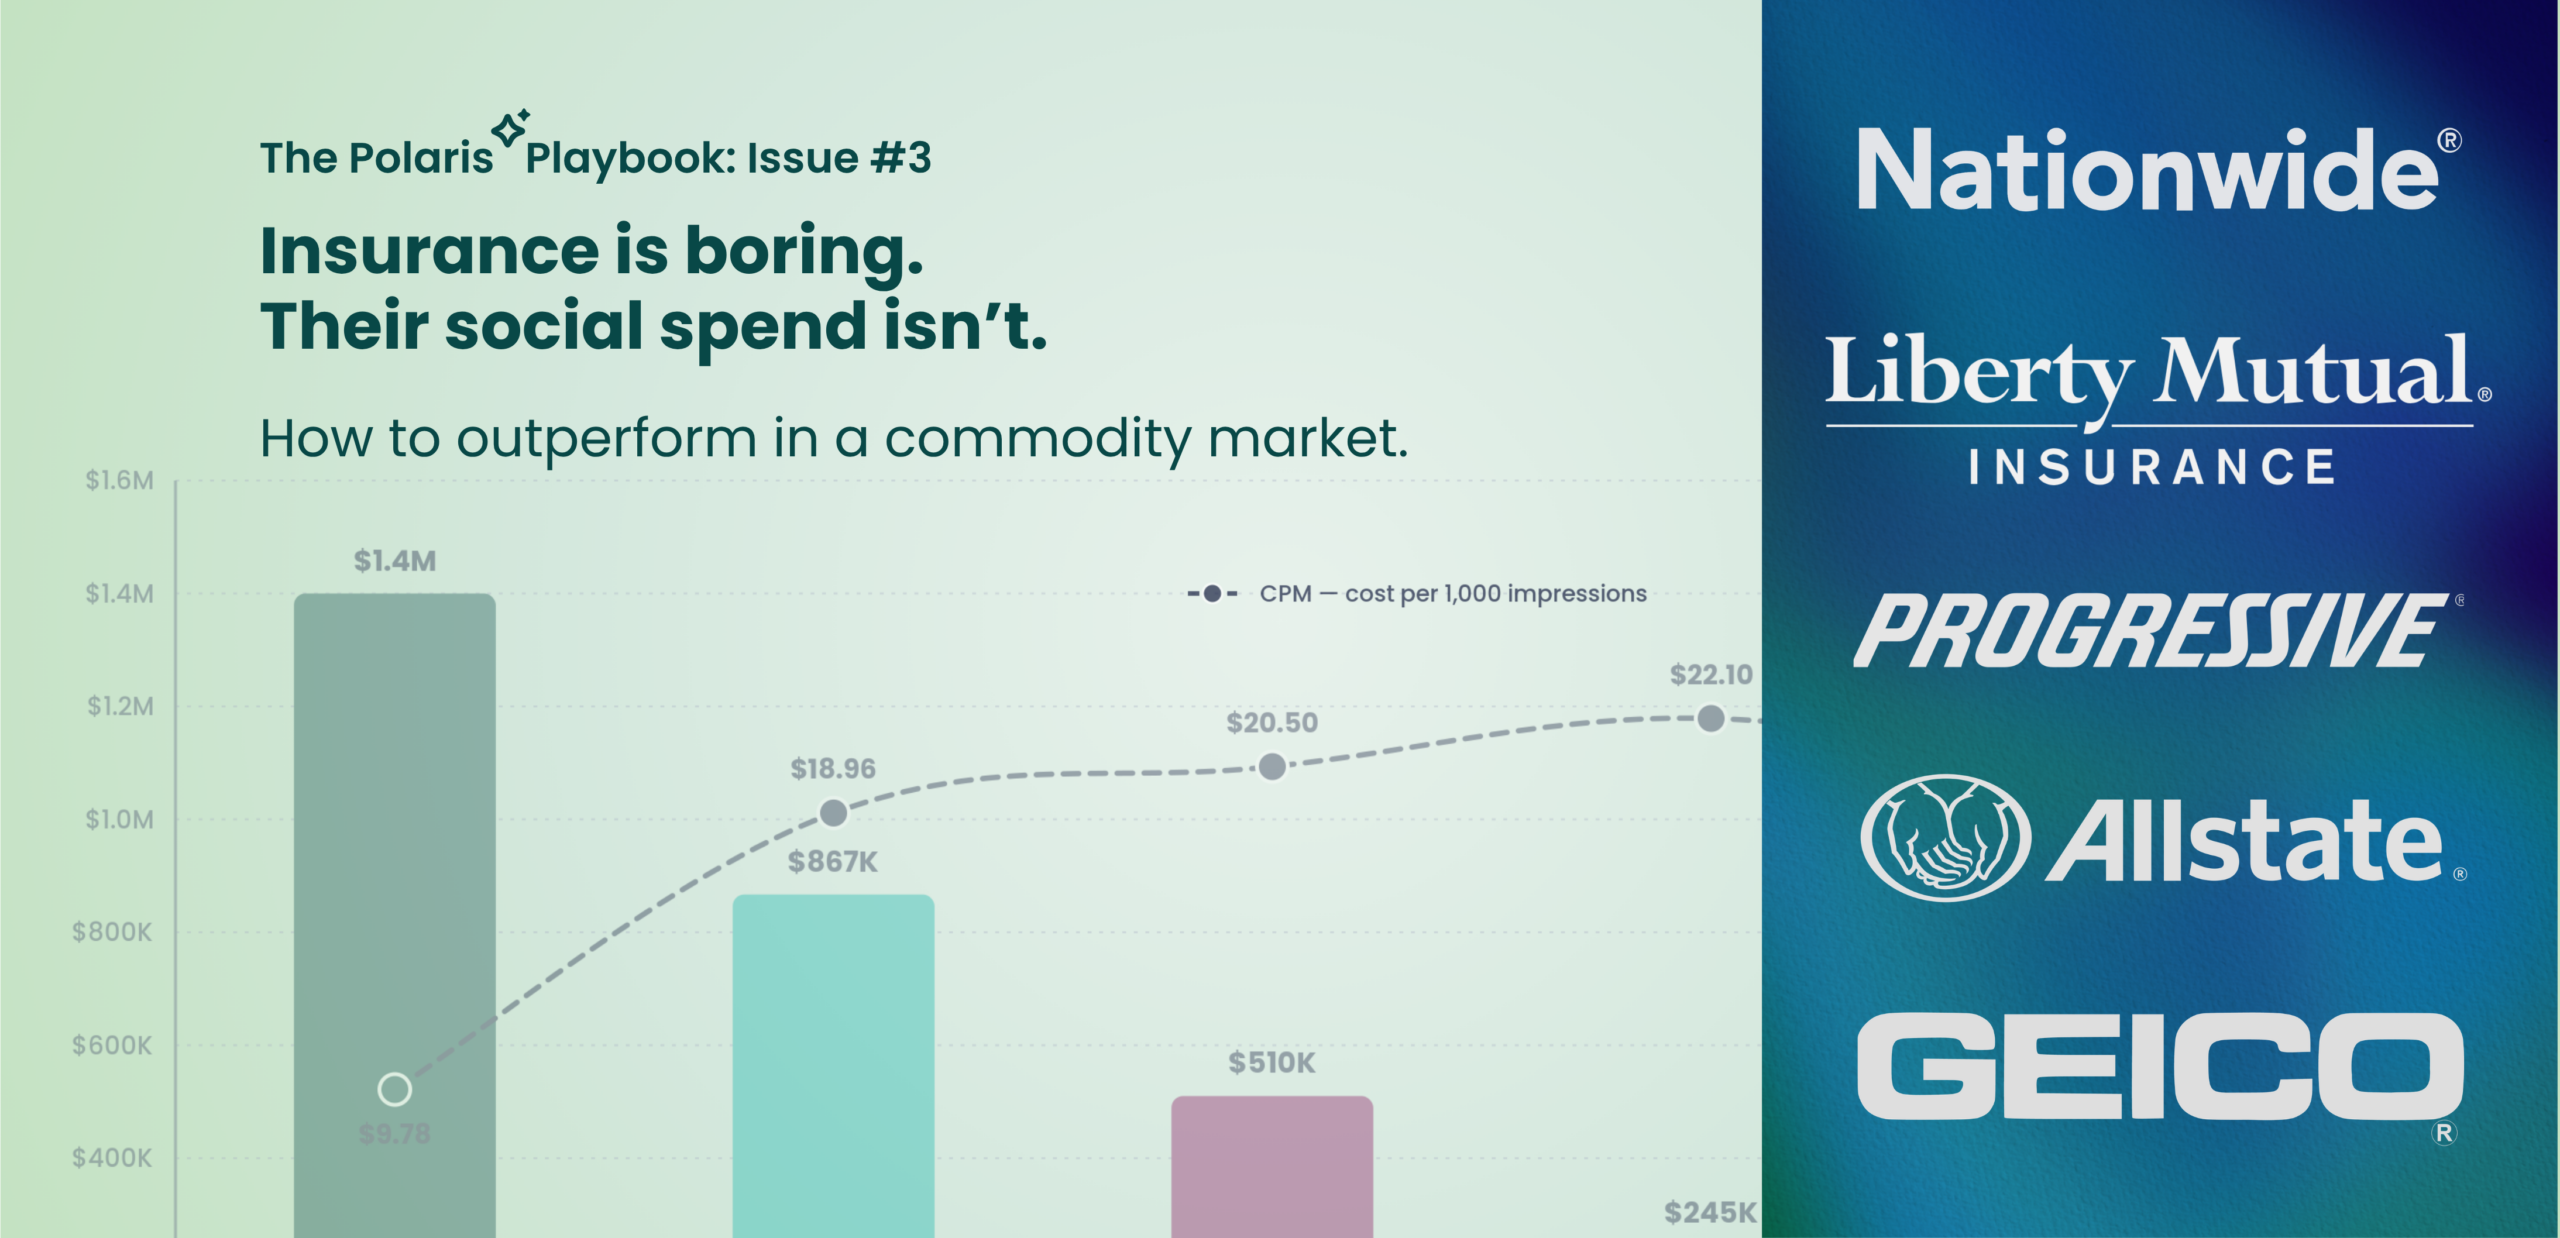
Insurance is Boring. Their Social Spend Isn’t.
Insurance products may look the same, but advertising performance doesn’t. In this edition of the Polaris Playbook, we analyze how Progressive, GEICO, Allstate, Liberty Mutual, and Nationwide allocate social ad spend — and uncover why Progressive’s CPM is more than 50% lower than competitors despite being the category’s biggest spender. The data reveals a broader competitive advantage hidden inside the auction itself.
View Now -
Most brands think they are data driven. They’re not.
In this breakdown, we use PolarisAI to compare American Express and PayPal, uncovering how PayPal achieved comparable performance with dramatically lower spend through smarter targeting, simpler messaging, and more efficient execution.
View Now