Discover viewability metrics per page with Browsi’s article cards
By Asaf Shamly | January 28, 2021

The shift from desktop to the mobile web has made the website homepage almost redundant. As you know, most mobile web users reach your site directly, through a social network, or via a search for a quick, one-time bite out of your content. In a world where users consume articles, optimizing an ad layout per site or section doesn’t cut it anymore and very well could turn out to be a waste of time and resources. Hectic and erratic mobile web user behavior has excelled Browsi’s focus on the viewability metrics and the creation of monetization experience per page.
Introducing the New Article Card
Browsi’s engine is optimizing every article it’s on. It looks into what the article is made of and how users interact with it. Based on this information, our engine automatically runs different ad experiences until it rapidly finds the best, most viewable and high-performance ad per article.
Browsi now offers complete reporting where it shows the performance of Browsi’s engine and all the data collected and used to optimize ad layout performance, discover additional inventory, monitor user behavior and more. All of it, per article page, so you can understand how your users and different pages react best to one another. Here are the main data components in the new Article Card:
Inventory and viewability metrics per article
- Additional placements per page – how many incremental potential ad locations were found by Browsi in your article.
- Av. percentage in view – the Browsi ad placement’s average percentage size kept in view.
- Av. time in view – the average time the Browsi ad placement was within a user’s view.
Traffic metrics per page
Traffic sources volume per each page (organic, social, search etc)
Engagement metrics
- Scroll depth – Represents how far users are scrolling on your page.
- Time on page – Represents the average time users spent on your page.
- Article bounce rate – Represents the percentage of visitors who enter the page and leave without continuing on to view other pages within your website.
Log in to your Browsi account and check out your viewability metrics per article with our new article cards!
Don’t have a Browsi account yet? Get started now!
Latest Articles
-
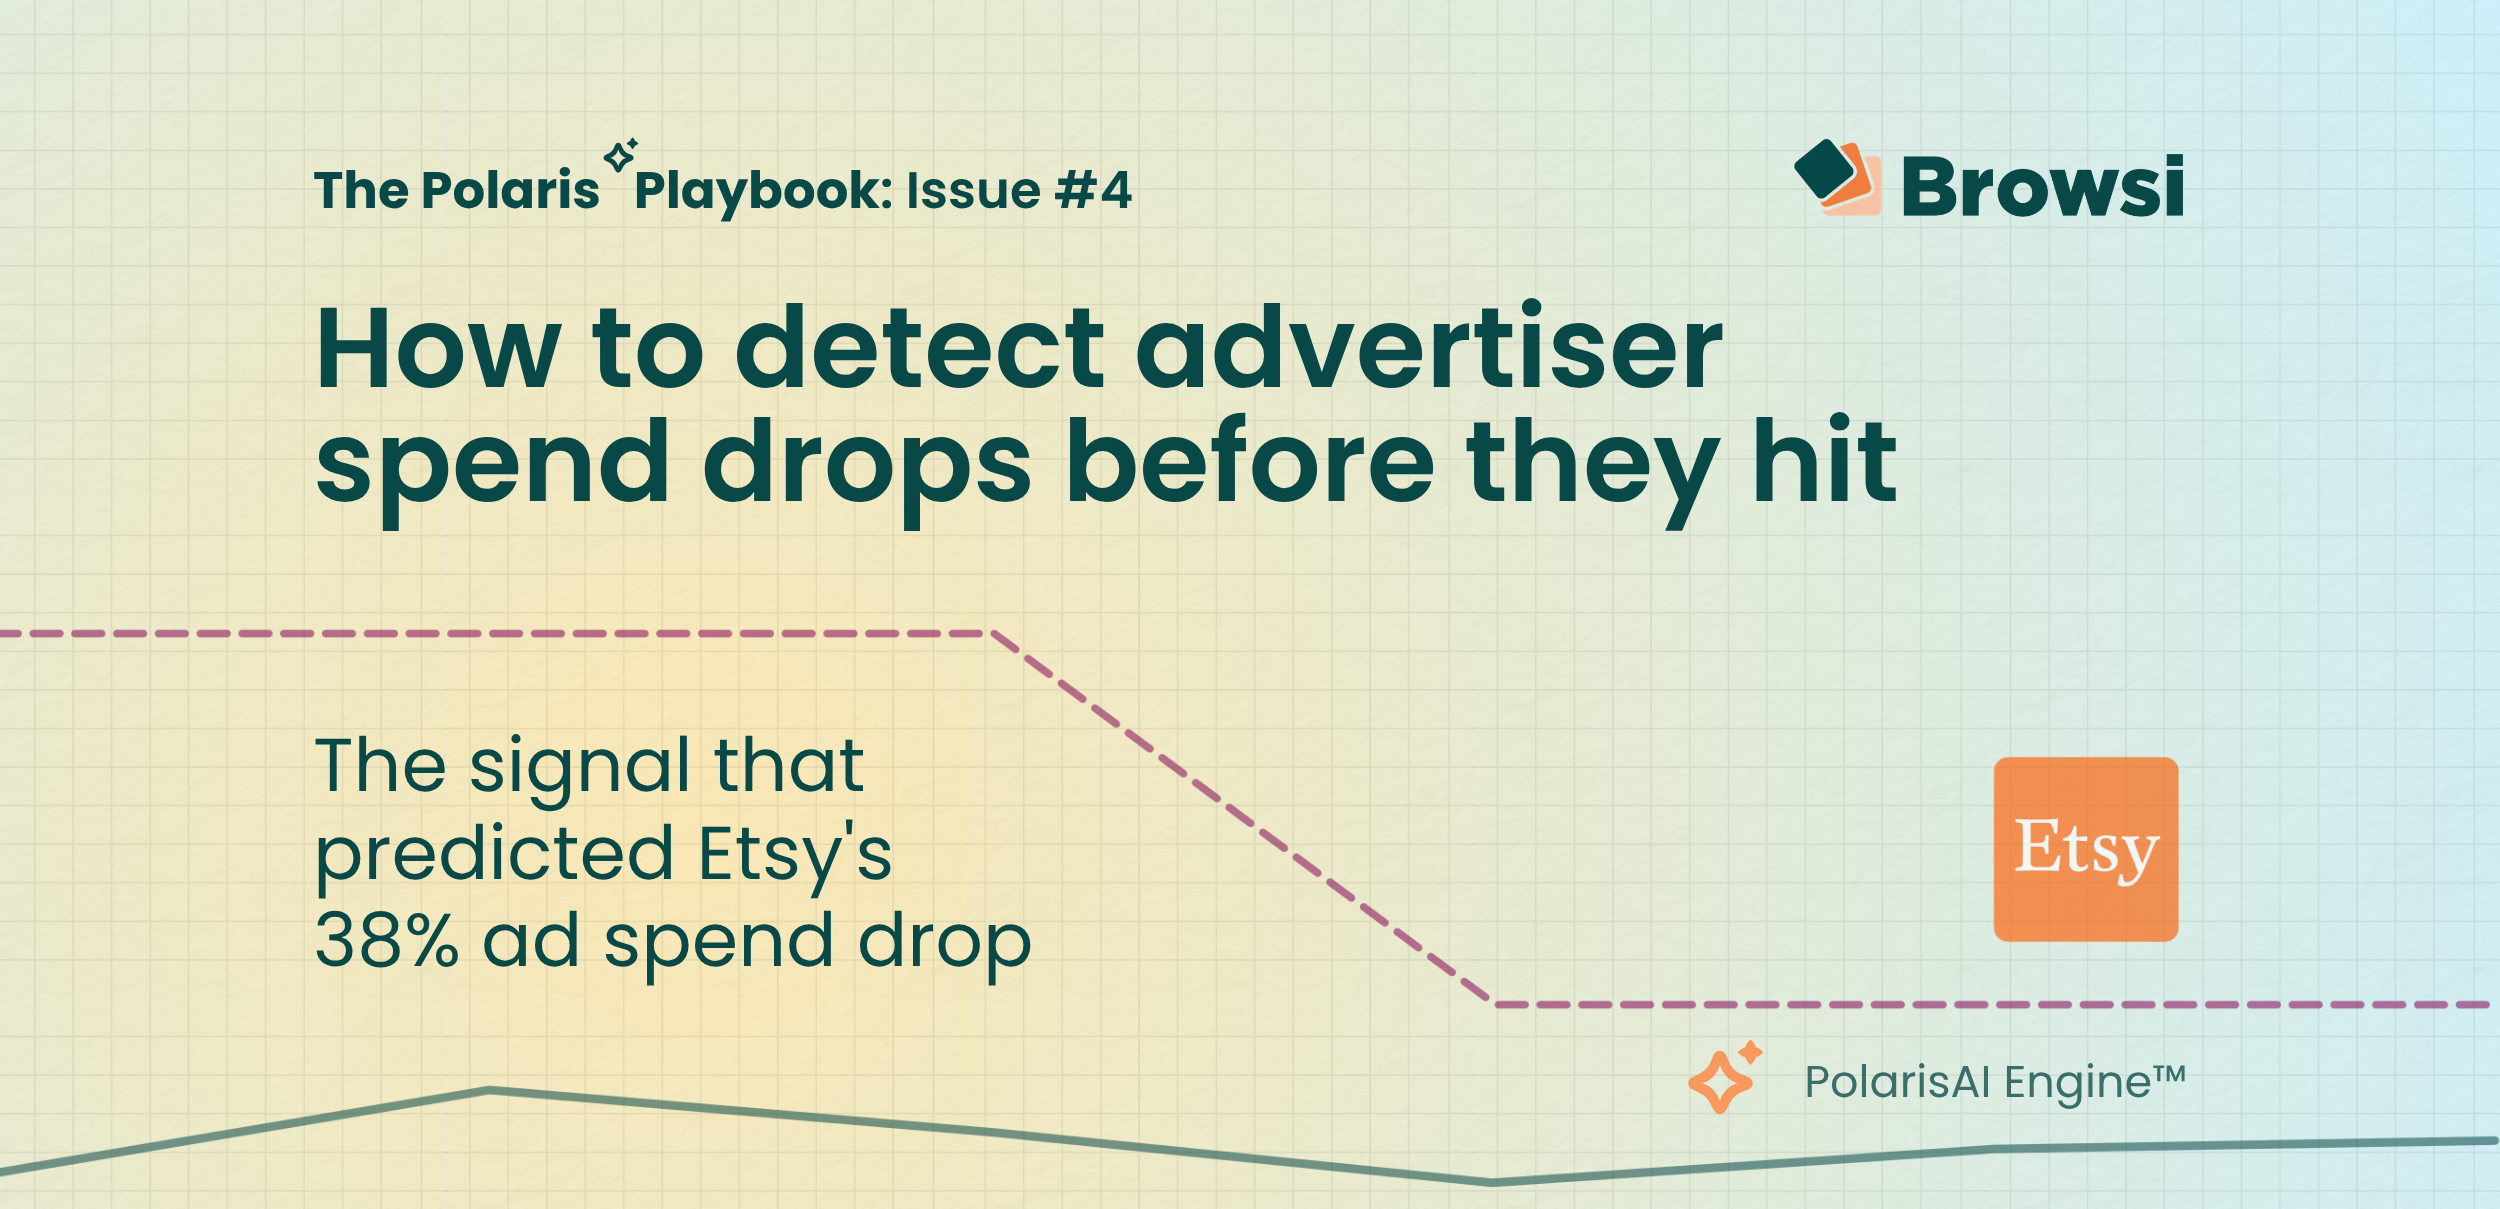
How to Detect Advertiser Spend Drops Before They Hit
Etsy's earnings confirmed what PolarisAI had already seen: a major pullback in marketing investment. By analyzing competitive signals before quarterly results were released, PolarisAI projected a 38% decline in spend while the market was still reacting to the underlying changes. The result highlights a growing reality for marketers: the most valuable competitive insights often emerge long before earnings calls explain them.
View Now -

How Accurate is Browsi’s Data? Tried and Tested.
Most marketers trust competitive spend data without questioning where the numbers come from. We tested PolarisAI Engine™ against the only benchmark that matters: what advertisers actually reported in their earnings calls. The result was an 87% correlation across five major brands, revealing the difference between data that looks confident and data grounded in reality.
View Now -
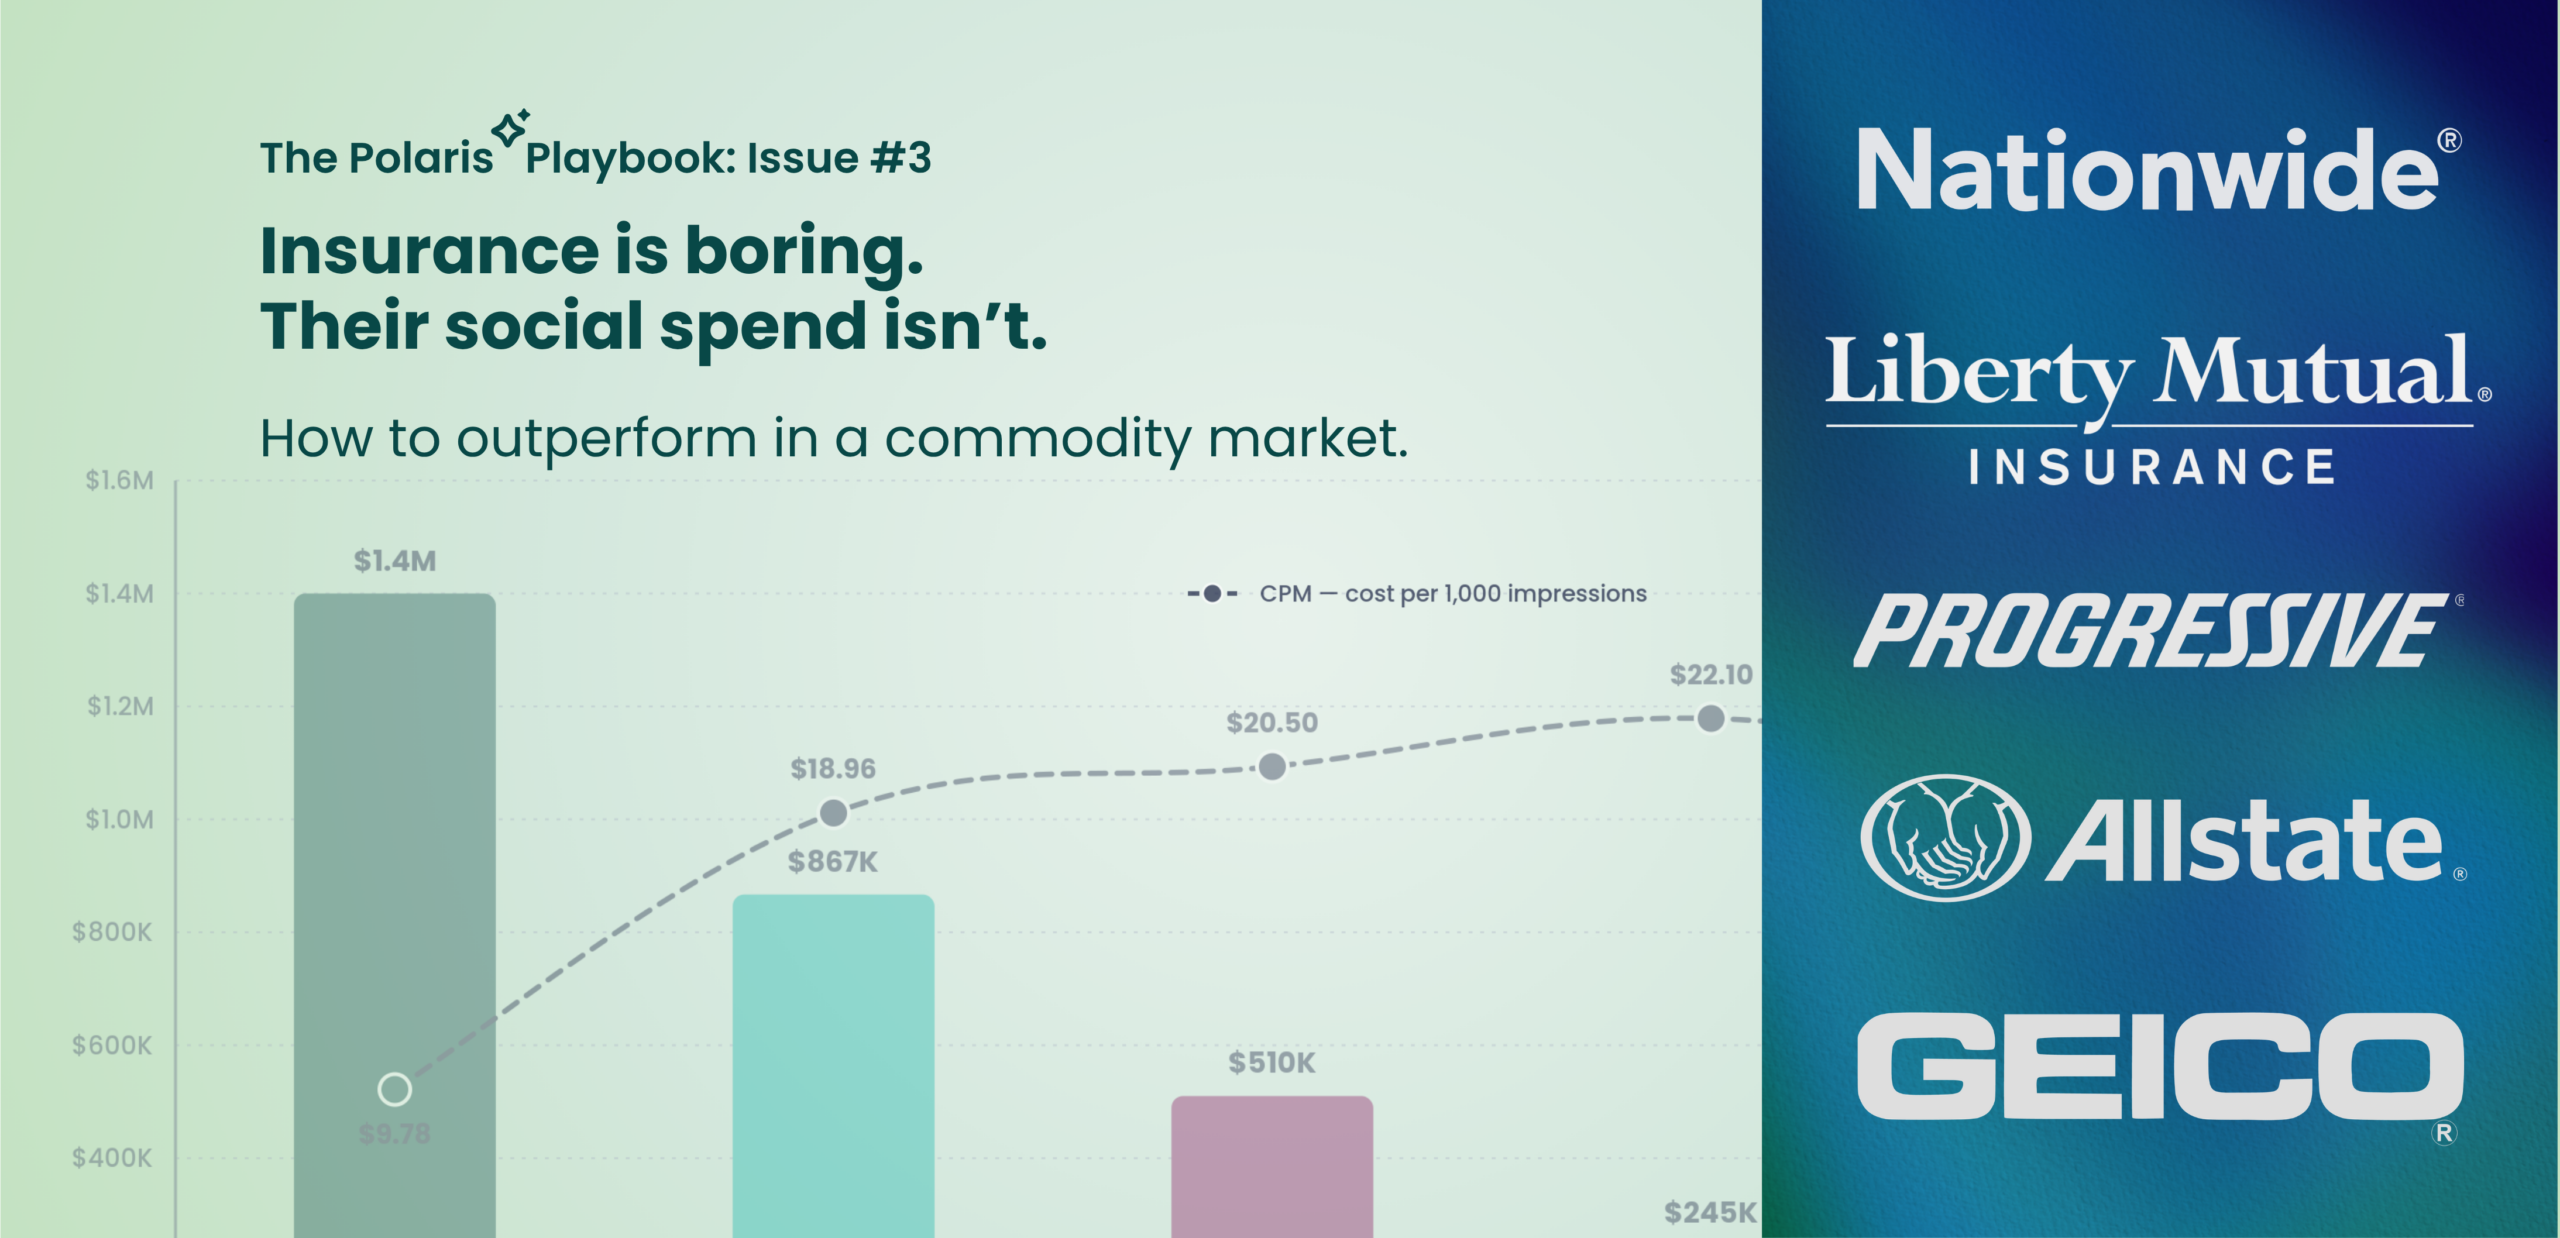
Insurance is Boring. Their Social Spend Isn’t.
Insurance products may look the same, but advertising performance doesn’t. In this edition of the Polaris Playbook, we analyze how Progressive, GEICO, Allstate, Liberty Mutual, and Nationwide allocate social ad spend — and uncover why Progressive’s CPM is more than 50% lower than competitors despite being the category’s biggest spender. The data reveals a broader competitive advantage hidden inside the auction itself.
View Now