The cost and process of optimizing viewability per page [infographic]
By Asaf Shamly | January 28, 2021
Viewability is not a challenge for advertisers… all they need is to ask for it and track it.
Viewability is a publisher challenge
An underperforming media is something only they can fix. The main reason for inefficient media is non-viewable ad placements. Ironically, these placements that are the publisher’s 2nd most important asset after content are created, managed and optimized almost the same way they were 21 years ago – manually, periodically, statically and at a macro level.
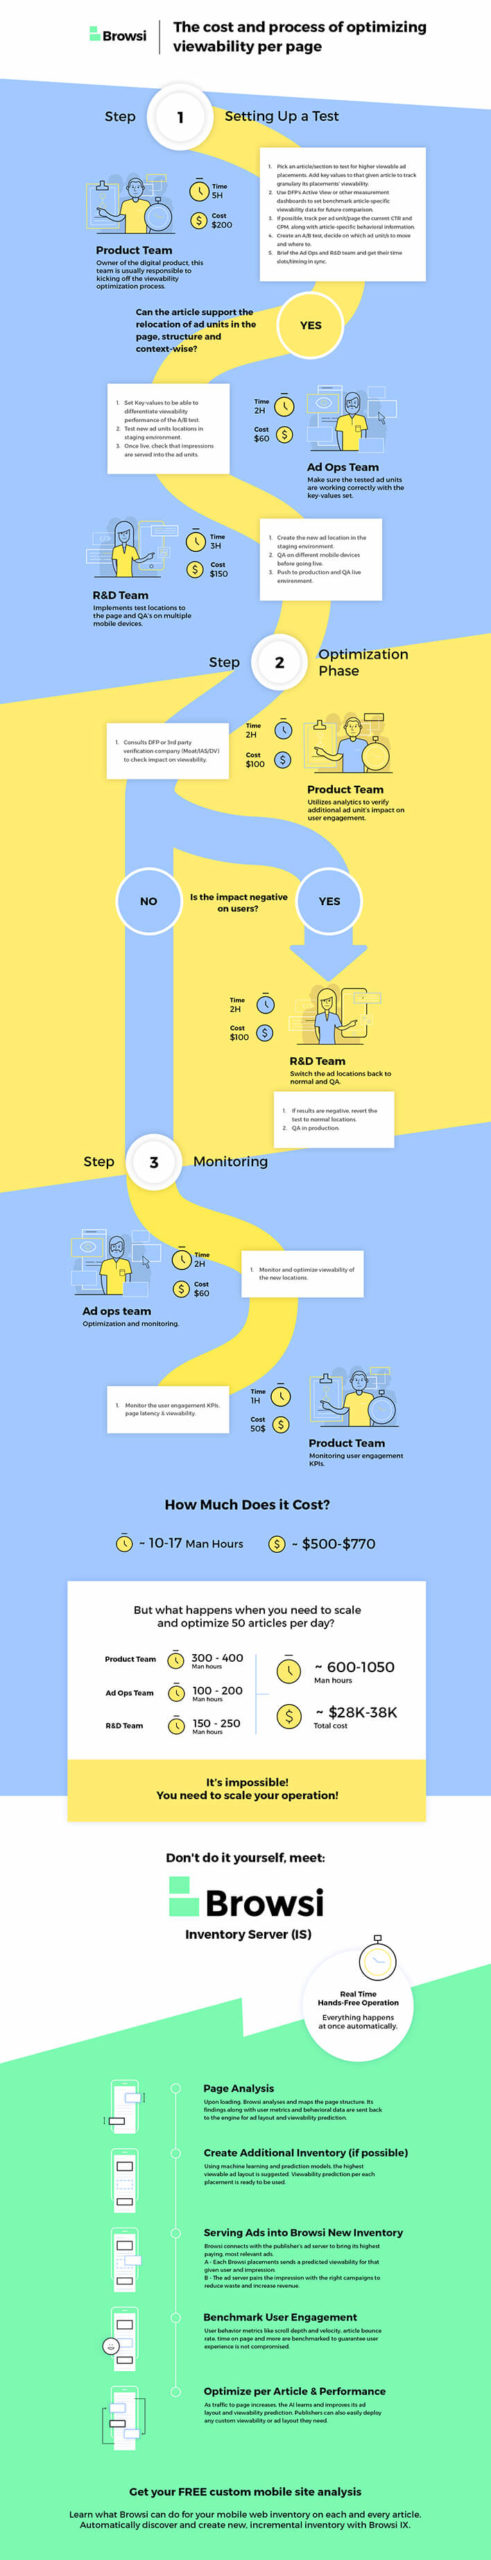
Publishers can’t optimize their media for viewability per any given article due to lack of ROI. Check our infographic below on the process to optimize viewability per article, its costs, and alternative options.
Latest Articles
-
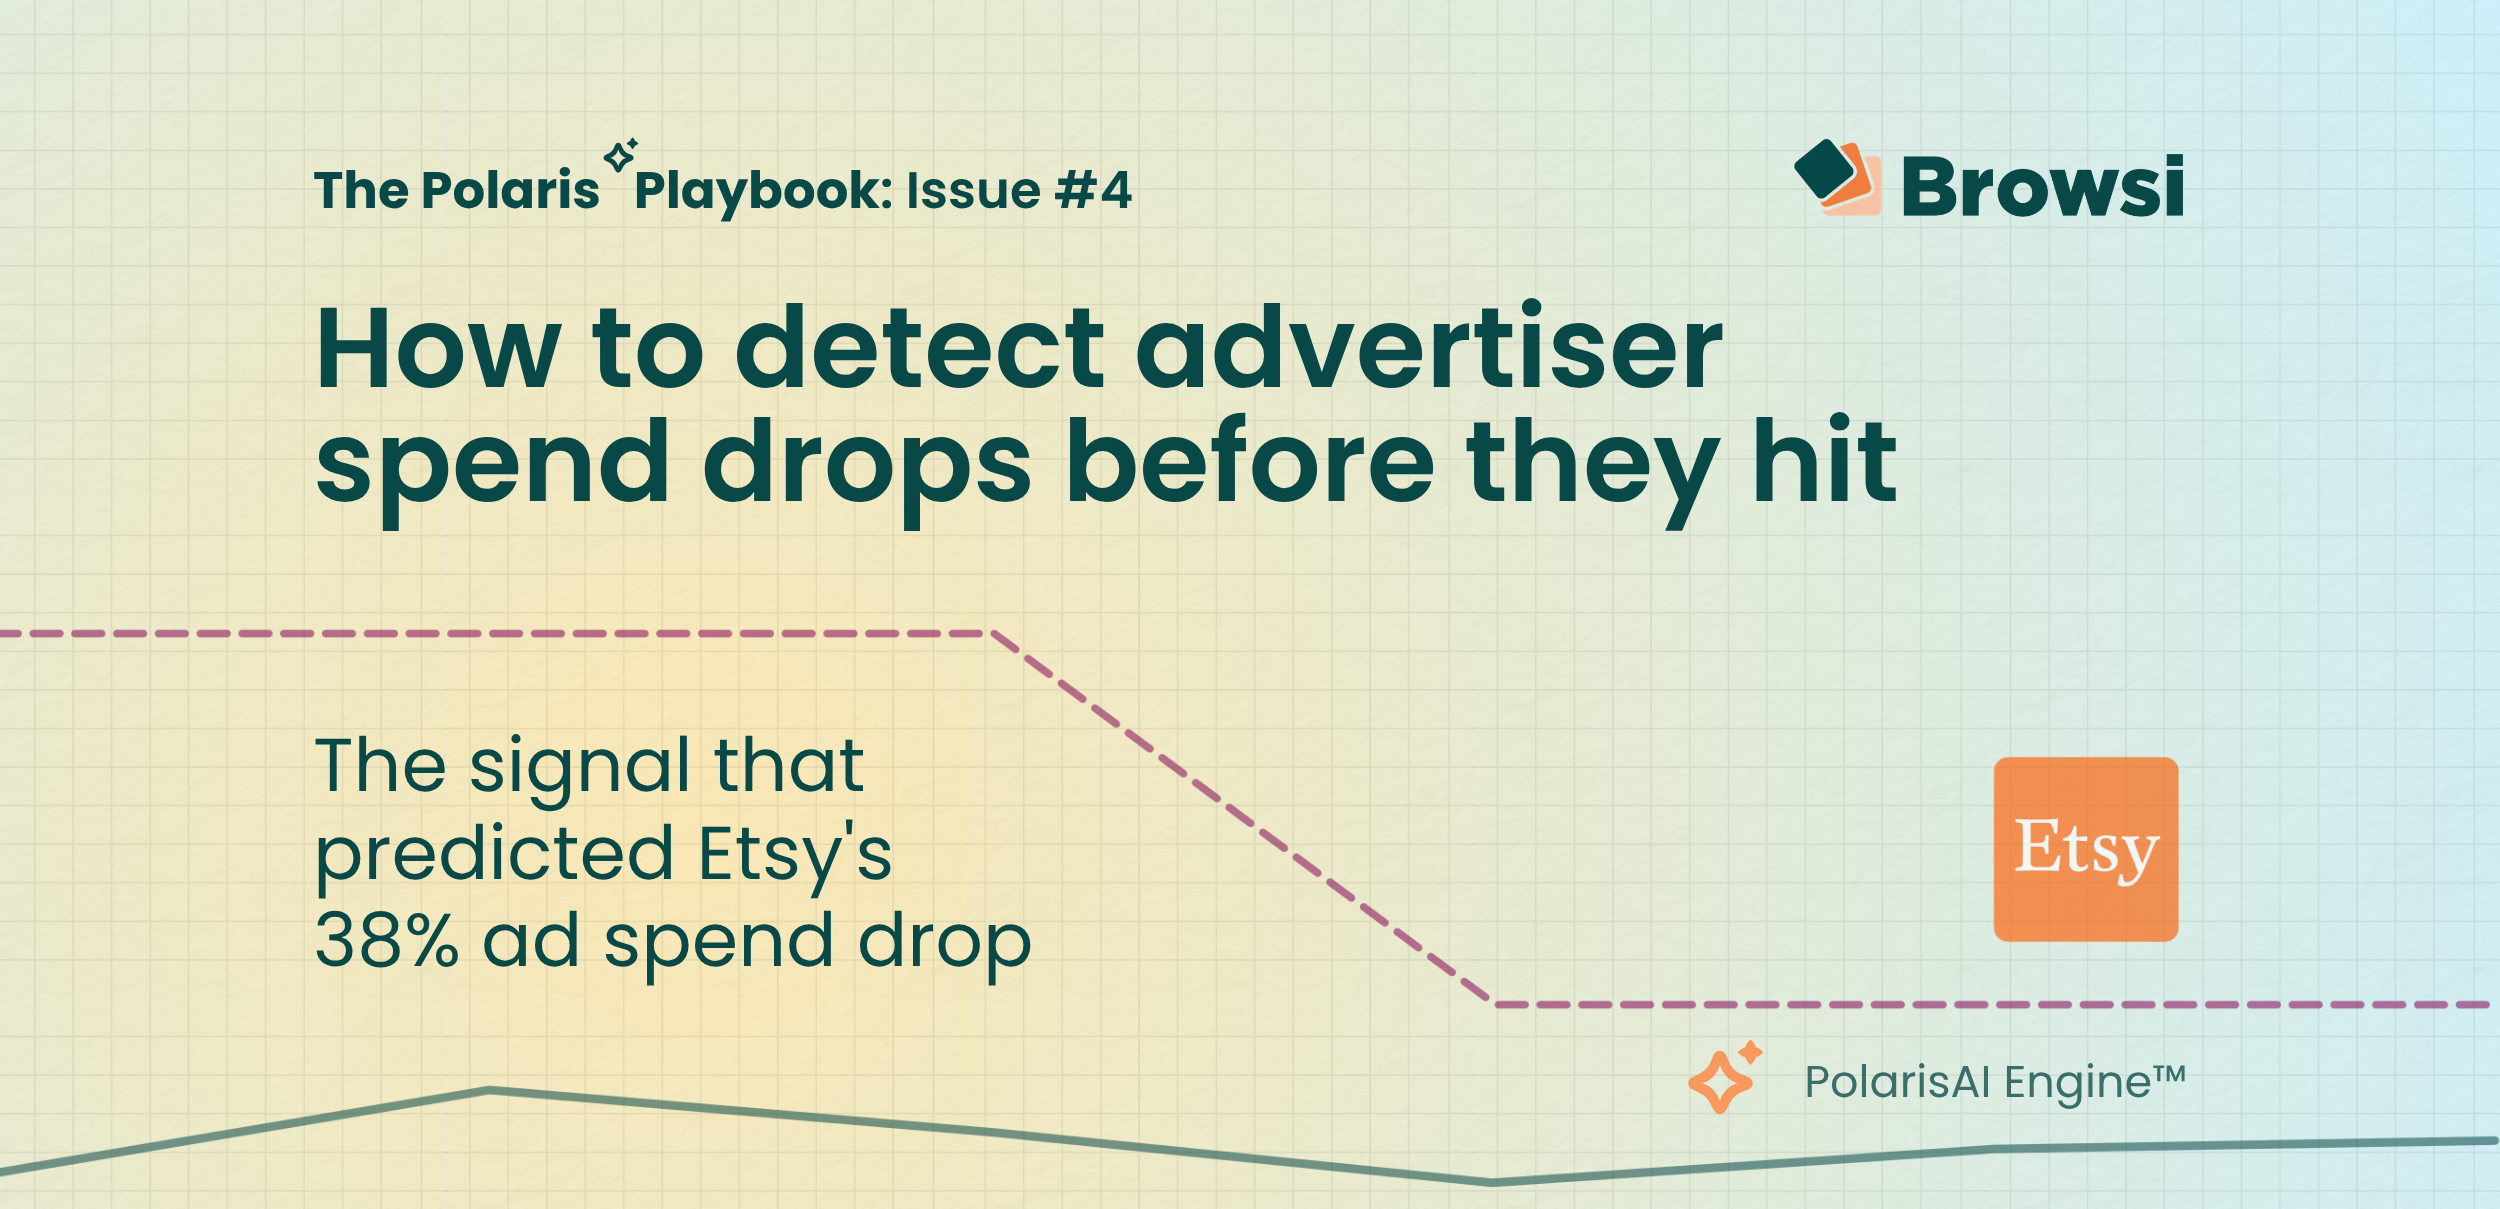
How to Detect Advertiser Spend Drops Before They Hit
Etsy's earnings confirmed what PolarisAI had already seen: a major pullback in marketing investment. By analyzing competitive signals before quarterly results were released, PolarisAI projected a 38% decline in spend while the market was still reacting to the underlying changes. The result highlights a growing reality for marketers: the most valuable competitive insights often emerge long before earnings calls explain them.
View Now -

How Accurate is Browsi’s Data? Tried and Tested.
Most marketers trust competitive spend data without questioning where the numbers come from. We tested PolarisAI Engine™ against the only benchmark that matters: what advertisers actually reported in their earnings calls. The result was an 87% correlation across five major brands, revealing the difference between data that looks confident and data grounded in reality.
View Now -
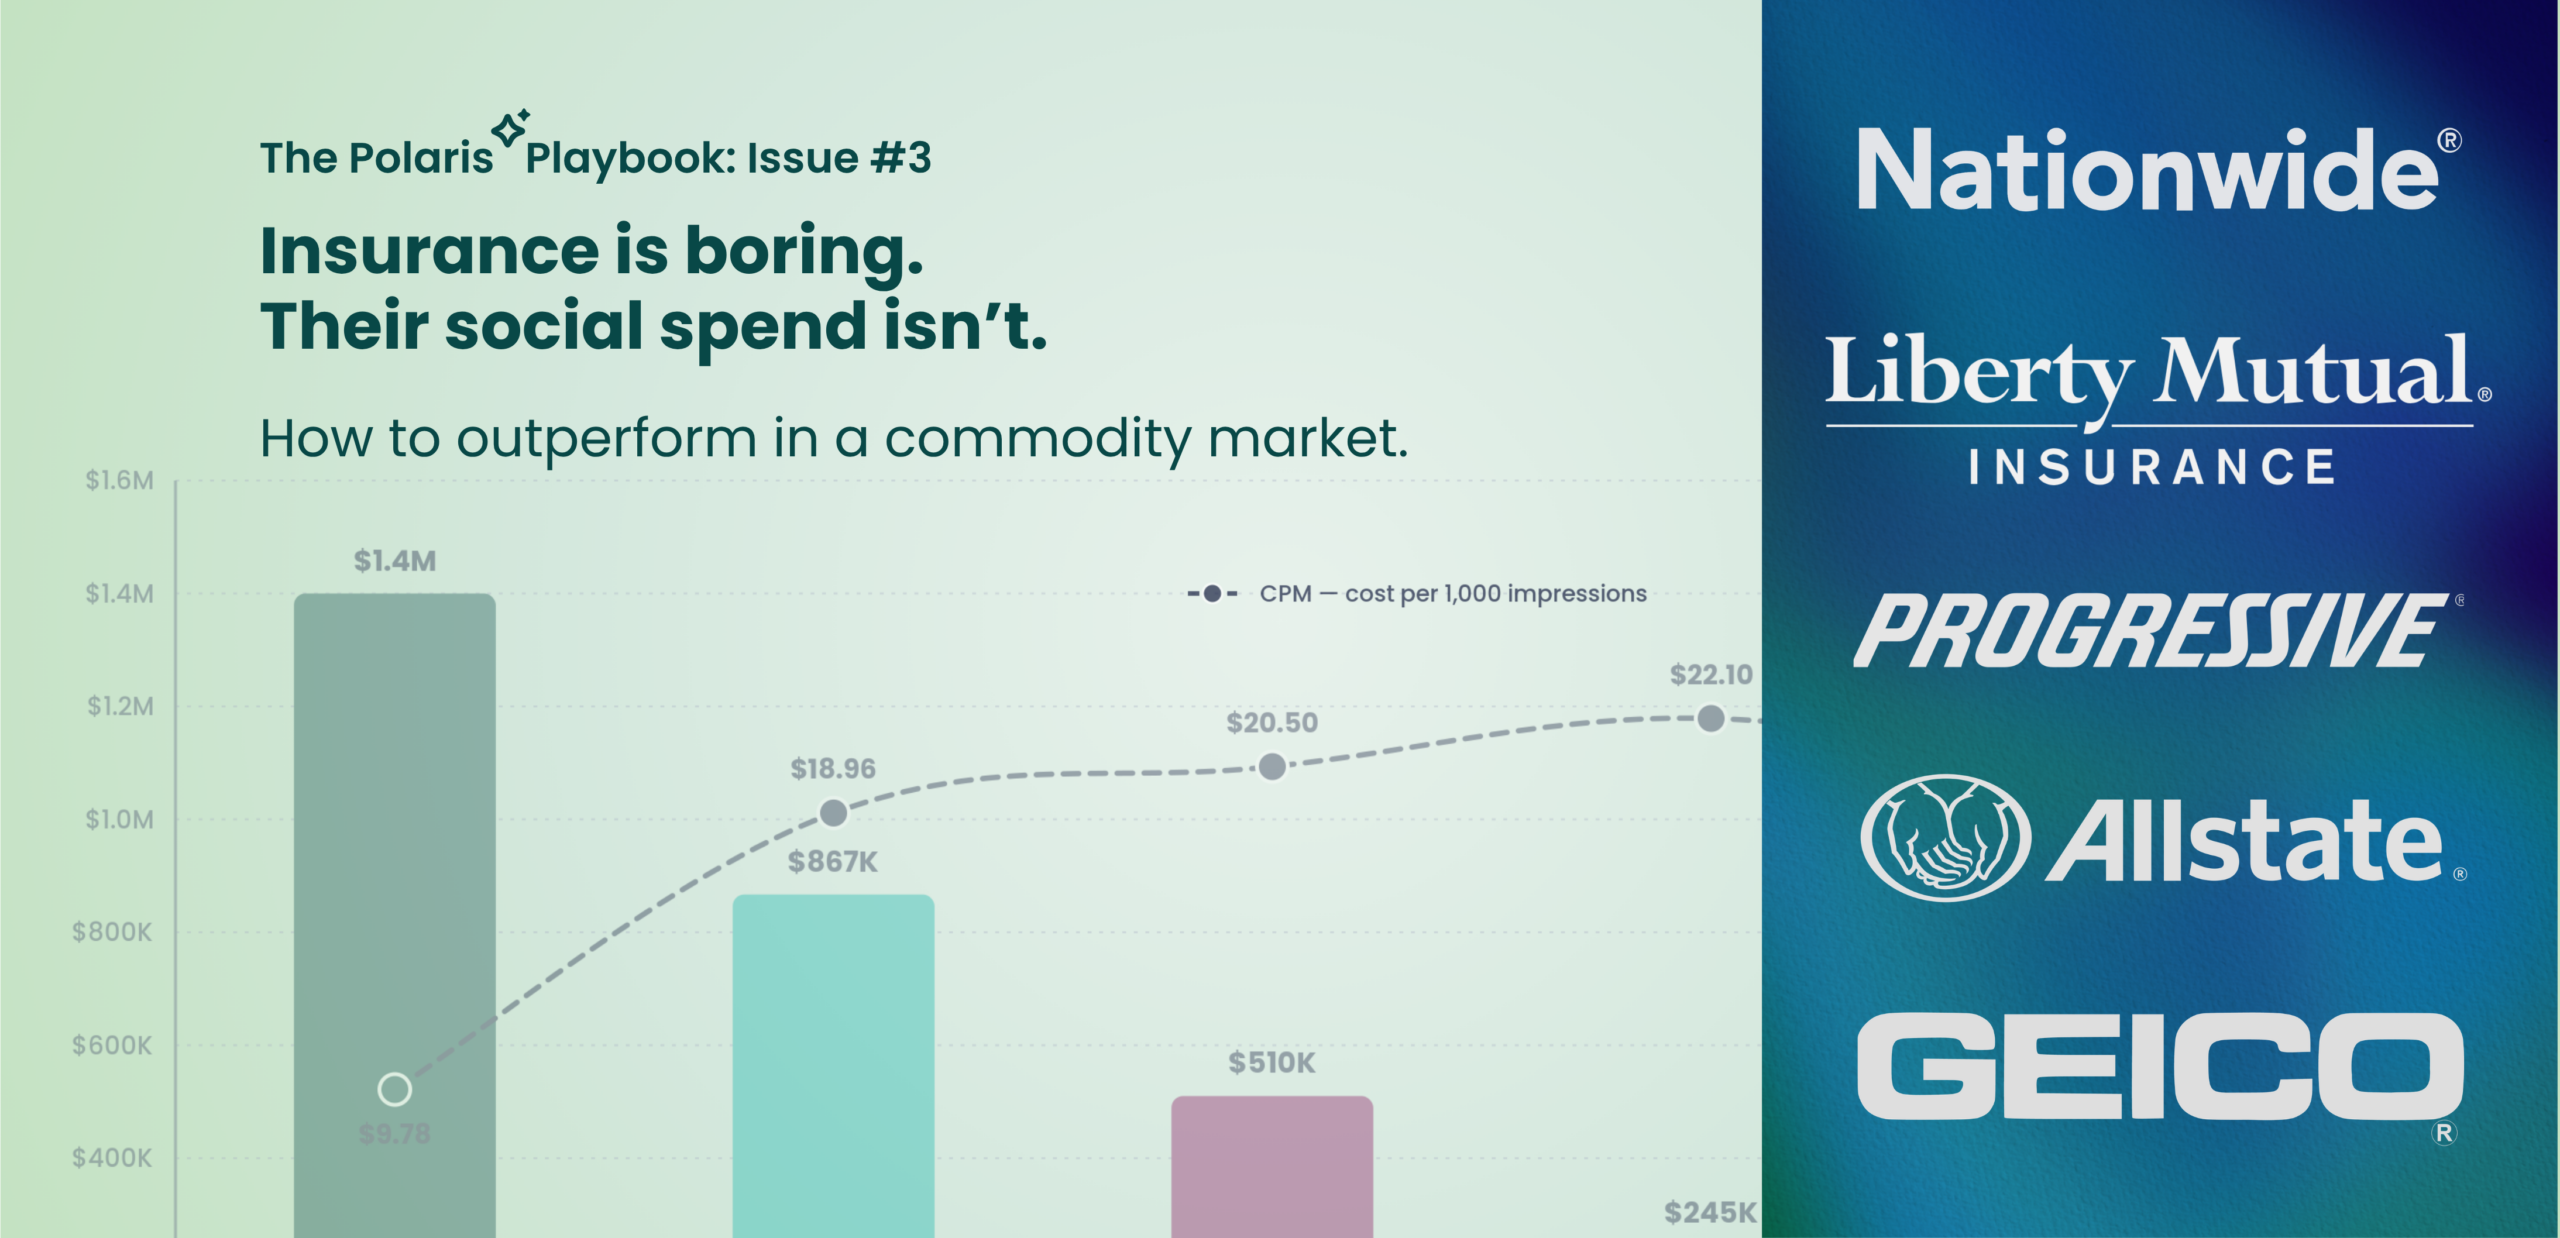
Insurance is Boring. Their Social Spend Isn’t.
Insurance products may look the same, but advertising performance doesn’t. In this edition of the Polaris Playbook, we analyze how Progressive, GEICO, Allstate, Liberty Mutual, and Nationwide allocate social ad spend — and uncover why Progressive’s CPM is more than 50% lower than competitors despite being the category’s biggest spender. The data reveals a broader competitive advantage hidden inside the auction itself.
View Now