Maximize Your UX & Revenue Data With Personalized Reports
By Browsi | October 18, 2022
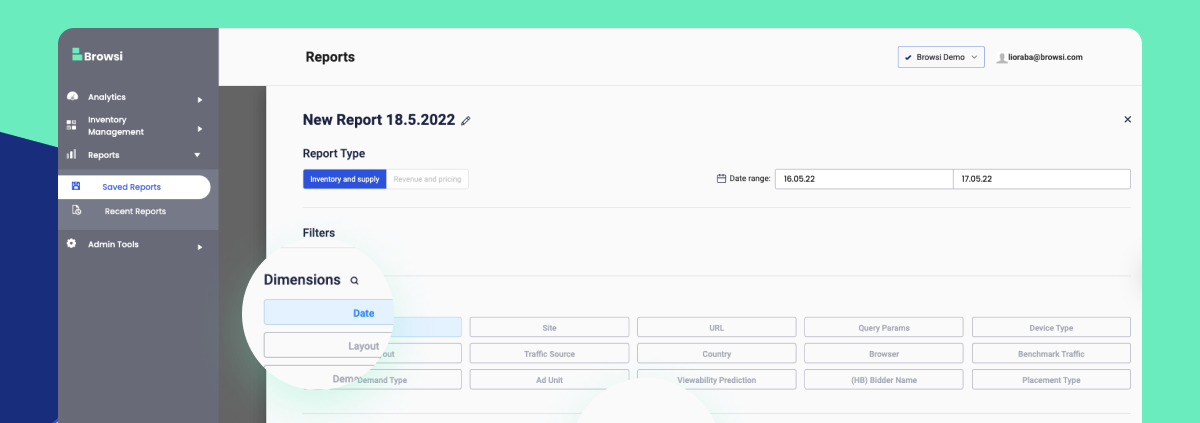
The Browsi query tool provides a personalized reporting system that enables full adjustment to your unique needs.
Filter, customize and automate scheduled reports based on unique metrics combinations and uncover insights to maximize your ad stack.
 Optimize Your Viewability
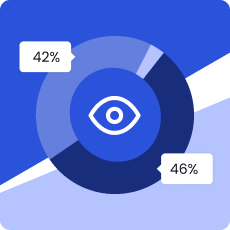
Break down your viewability rate per ad layout or even per ad unit to uncover exactly which ad layout or ad unit is dragging your average down.
 Analyze Your Demand Funnel
Deep dive into your revenue data from all types of providers to find out which one is performing better and leverage these insights to improve your ad revenue.
 Investigate Your Page & Engagement
See how your users engage with different ad layouts and identify where most of your pageviews are coming from (device types, traffic sources and more).
Ready to uncover insights and step up your ad layout strategy?
Let’s schedule a 15-min call to walk you through our robust reporting system and evaluate how unleashing AI behind your digital real estate can help you grow your revenue and improve your UX.
Latest Articles
-

The 6-step framework for turning signals into strategy
Competitive intelligence only matters if it leads to action. In this edition of The Polaris Playbook, we use Honda and five competitors to demonstrate a practical six-step framework for turning competitive signals into strategic recommendations marketers can actually use.
View Now -
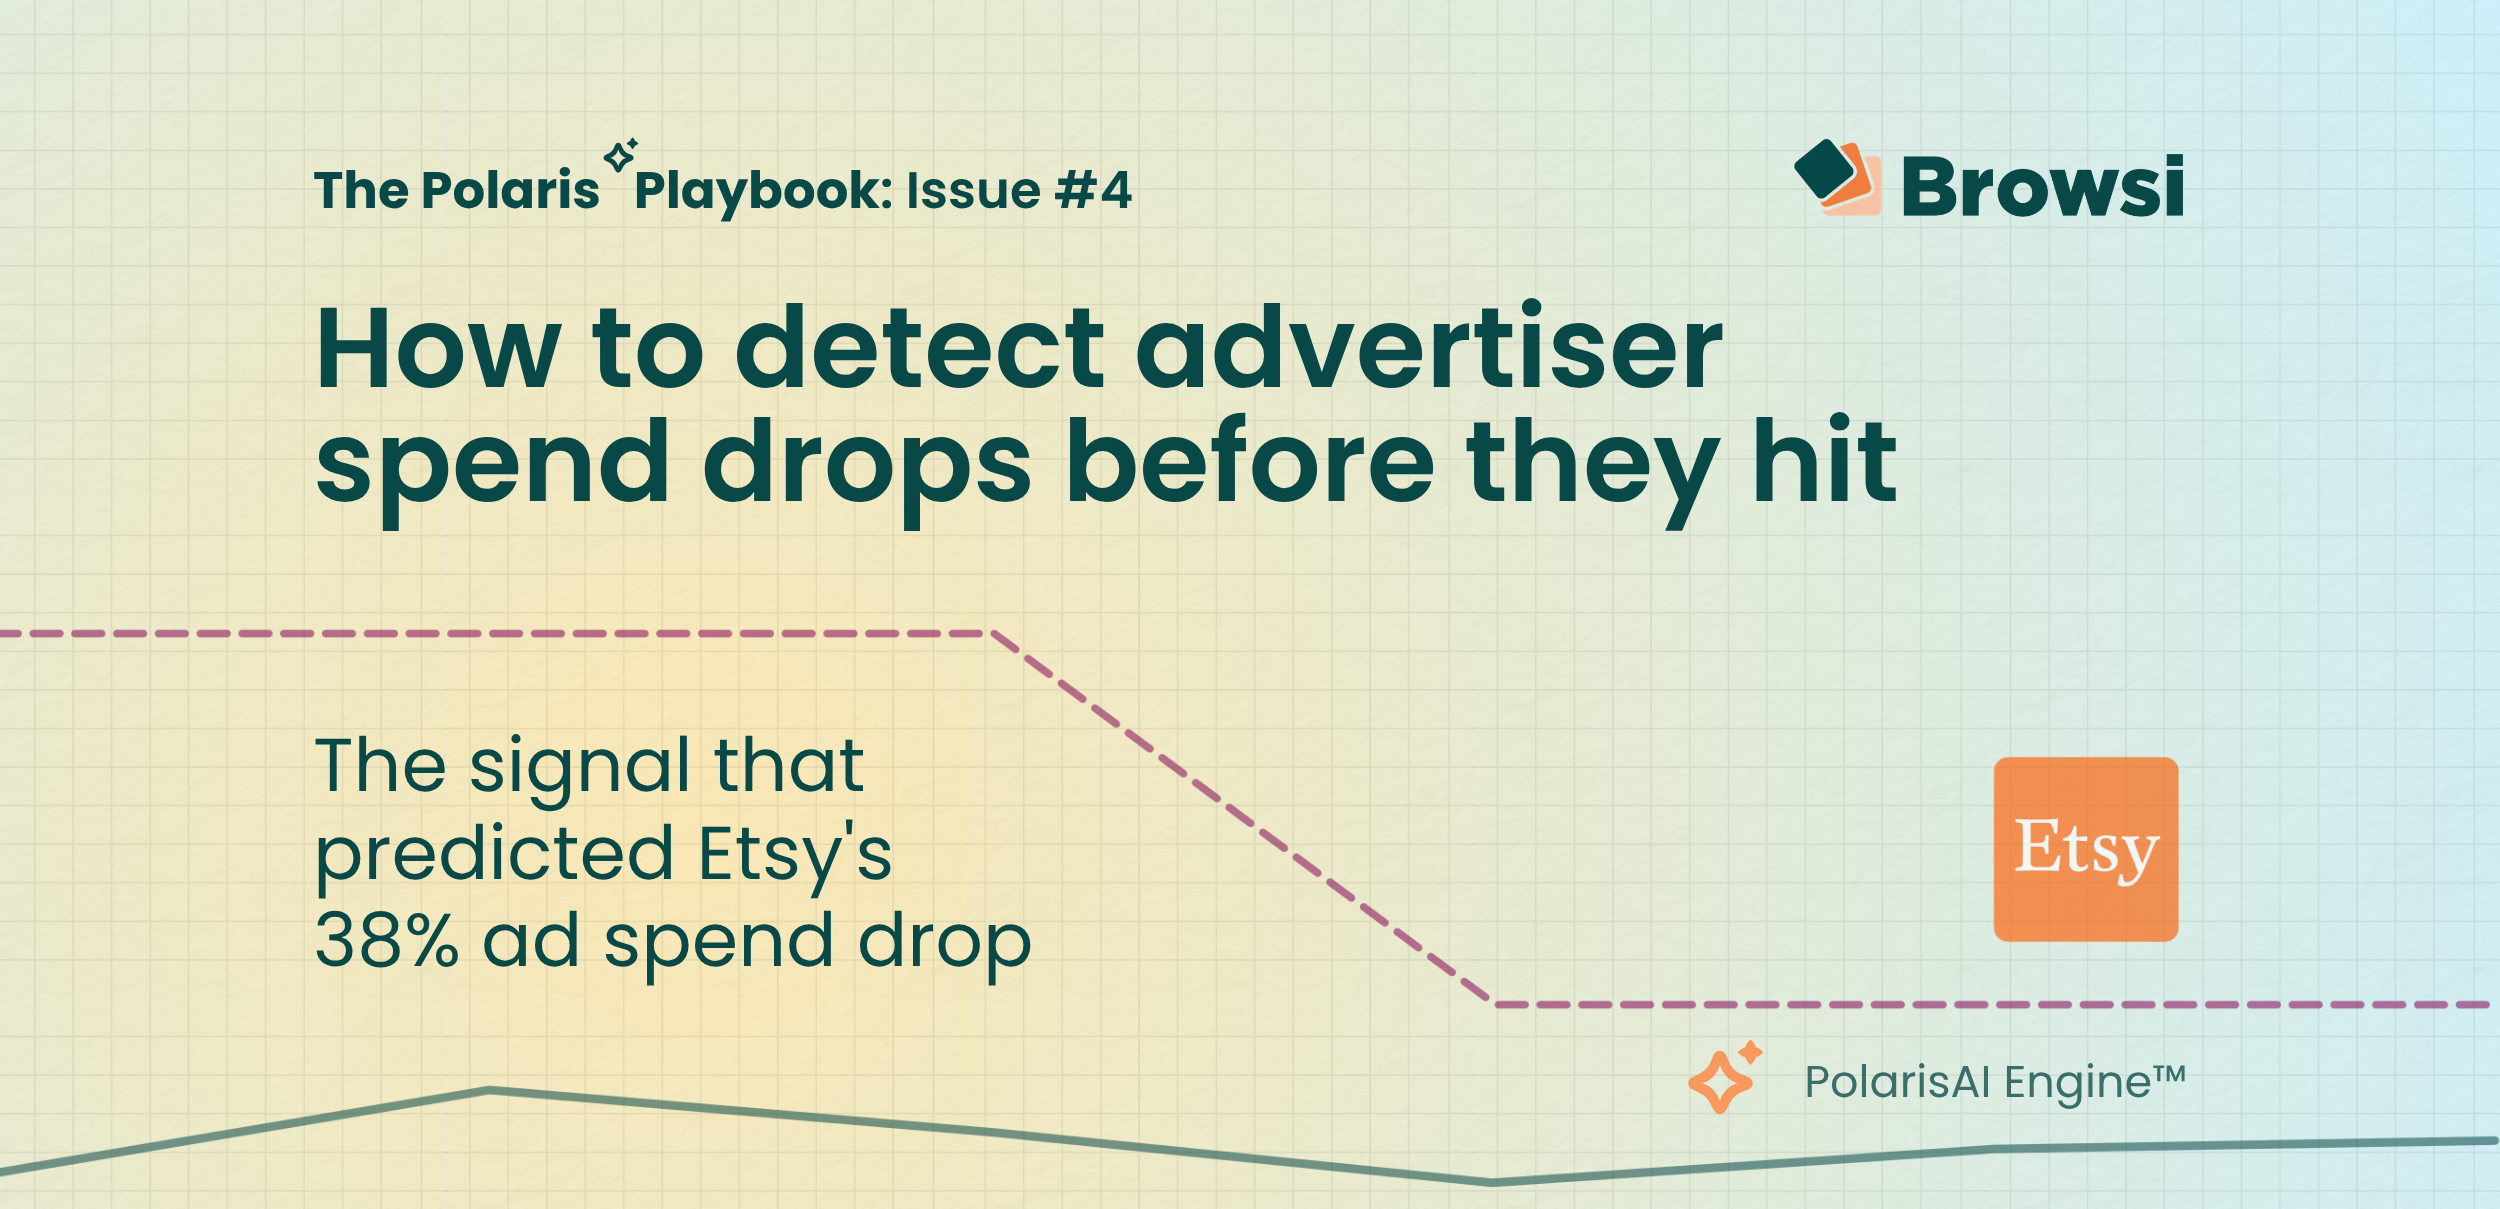
How to Detect Advertiser Spend Drops Before They Hit
Etsy's earnings confirmed what PolarisAI had already seen: a major pullback in marketing investment. By analyzing competitive signals before quarterly results were released, PolarisAI projected a 38% decline in spend while the market was still reacting to the underlying changes. The result highlights a growing reality for marketers: the most valuable competitive insights often emerge long before earnings calls explain them.
View Now -

How Accurate is Browsi’s Data? Tried and Tested.
Most marketers trust competitive spend data without questioning where the numbers come from. We tested PolarisAI Engine™ against the only benchmark that matters: what advertisers actually reported in their earnings calls. The result was an 87% correlation across five major brands, revealing the difference between data that looks confident and data grounded in reality.
View Now