Optimizing Viewability Per Page – Manual vs. Real-Time Process [Infographic]
By Asaf Shamly | January 27, 2021

Meeting viewability targets has long been one of the biggest challenges facing publishers, and with good reason: Advertisers don’t want to waste their online marketing budget on impressions that aren’t actually being seen by users.
Low viewability could be due to several different reasons, including users who have installed ad blockers and pages that have been opened by a bot. But it could also be due to issues that publishers have more control over, such as ad layout.
Even though ad inventory is the publisher’s second-most important asset, after content creation, it is still managed and optimized inefficiently: it’s a manual process involving multiple teams (UX, Product, R&D and Ad Ops), repeated every few months, at the macro level.
Publishers can’t optimize their ad inventory for viewability per any given page due to lack of ROI. The costs and time needed to scale up to meet viewability targets can be daunting (and often impossible to meet).
THERE IS A BETTER WAY TO SCALE UP.
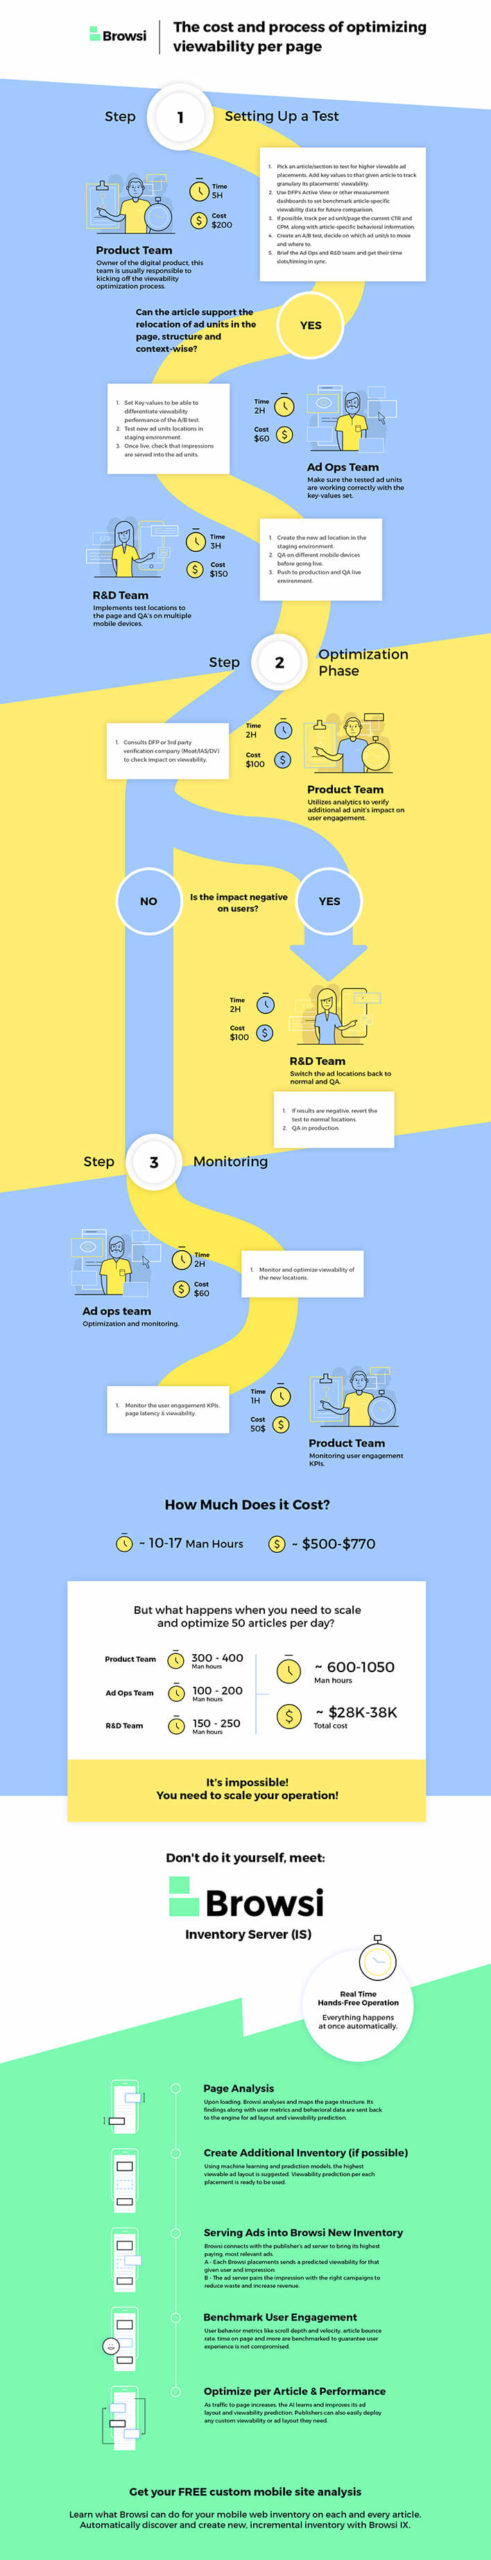
Check our infographic below detailing the cost and the process of optimizing viewability per page and why you need to adopt a real-time, automated process using AI-powered ad inventory.
Want to learn more? Talk to a specialist today.
Latest Articles
-

The 6-step framework for turning signals into strategy
Competitive intelligence only matters if it leads to action. In this edition of The Polaris Playbook, we use Honda and five competitors to demonstrate a practical six-step framework for turning competitive signals into strategic recommendations marketers can actually use.
View Now -
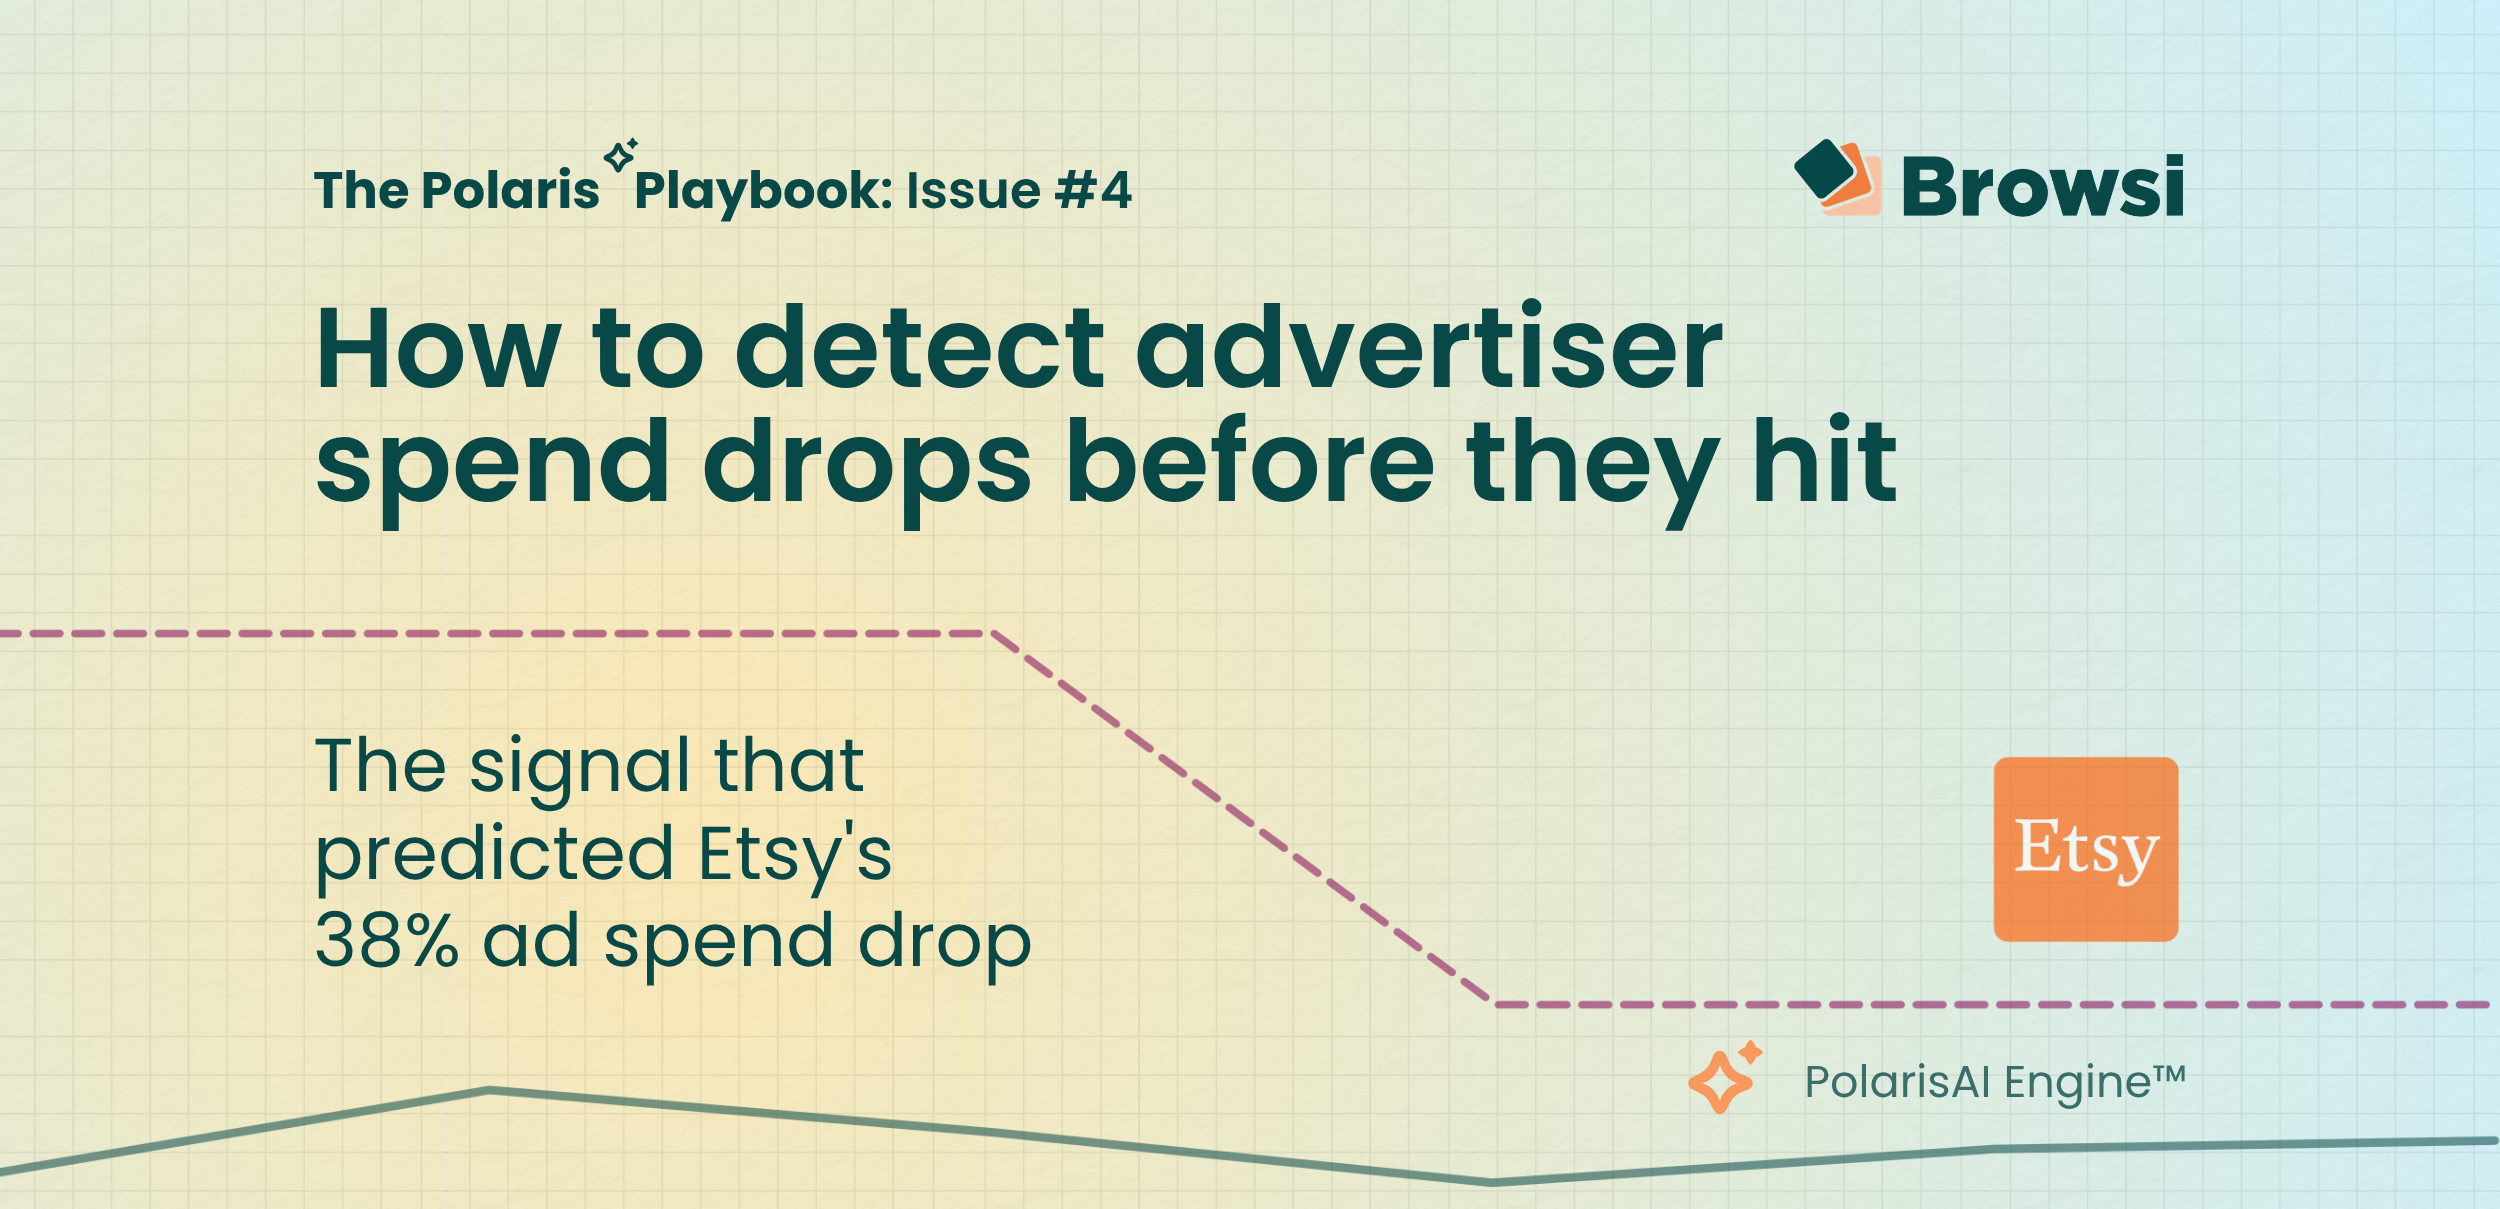
How to Detect Advertiser Spend Drops Before They Hit
Etsy's earnings confirmed what PolarisAI had already seen: a major pullback in marketing investment. By analyzing competitive signals before quarterly results were released, PolarisAI projected a 38% decline in spend while the market was still reacting to the underlying changes. The result highlights a growing reality for marketers: the most valuable competitive insights often emerge long before earnings calls explain them.
View Now -

How Accurate is Browsi’s Data? Tried and Tested.
Most marketers trust competitive spend data without questioning where the numbers come from. We tested PolarisAI Engine™ against the only benchmark that matters: what advertisers actually reported in their earnings calls. The result was an 87% correlation across five major brands, revealing the difference between data that looks confident and data grounded in reality.
View Now