Segment and price your ad inventory in real-time with VIEWABILITY PREDICTION
By Browsi | August 19, 2021
No more guessing blindly, no more one-size-fits-all pricing and no more wasted opportunities!
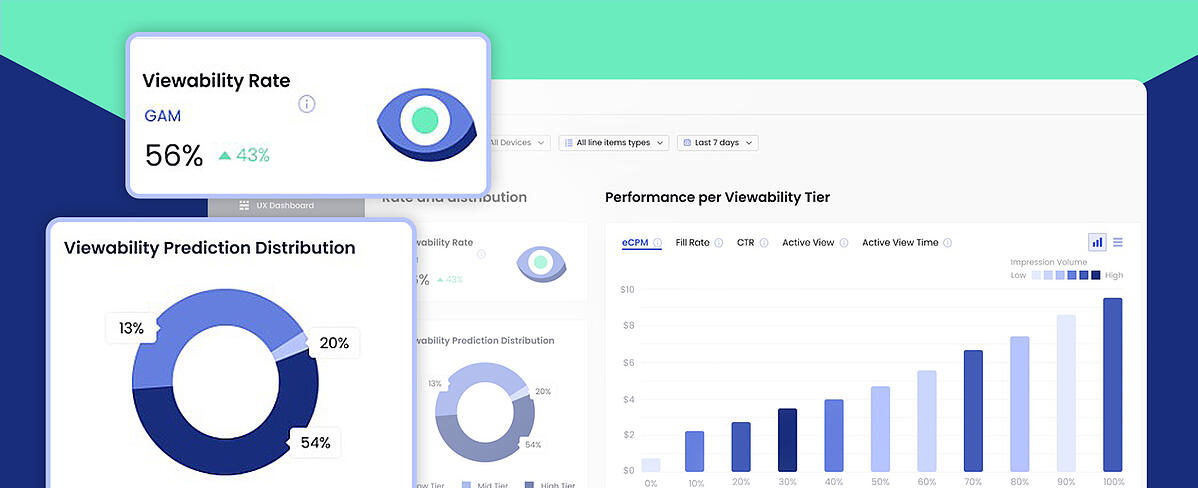
Browsi’s Viewability Prediction solution enables you to leverage real-time viewability predictions to easily segment your inventory into quality tiers and offer buyers the right segment at the optimal price in real time.
✓ Reduce ad waste
✓ Optimize your ad inventory
✓ Hit campaign goals faster
 Direct Sales
Identify viewability tiers to create more granular pricing for your Direct orders and then smartly manage your ad inventory to reach your campaign goals faster.
 Private Auctions
Give your PMP/PA clients unique offers and build long-term relationships with them to stand out from other publishers.
 Open Auctions
Find the optimal floor price per tier for Programmatic auctions instead of having a unified floor price regardless of the viewability tier.
Want to gain control of which demand goes into which viewability tier?
Browsi’s Viewability Prediction will enable you to match high viewability-focused campaigns with real-time high viewable placements and vice versa for low viewability tiers, keeping your impression waste to a minimum.
Latest Articles
-

The 6-step framework for turning signals into strategy
Competitive intelligence only matters if it leads to action. In this edition of The Polaris Playbook, we use Honda and five competitors to demonstrate a practical six-step framework for turning competitive signals into strategic recommendations marketers can actually use.
View Now -
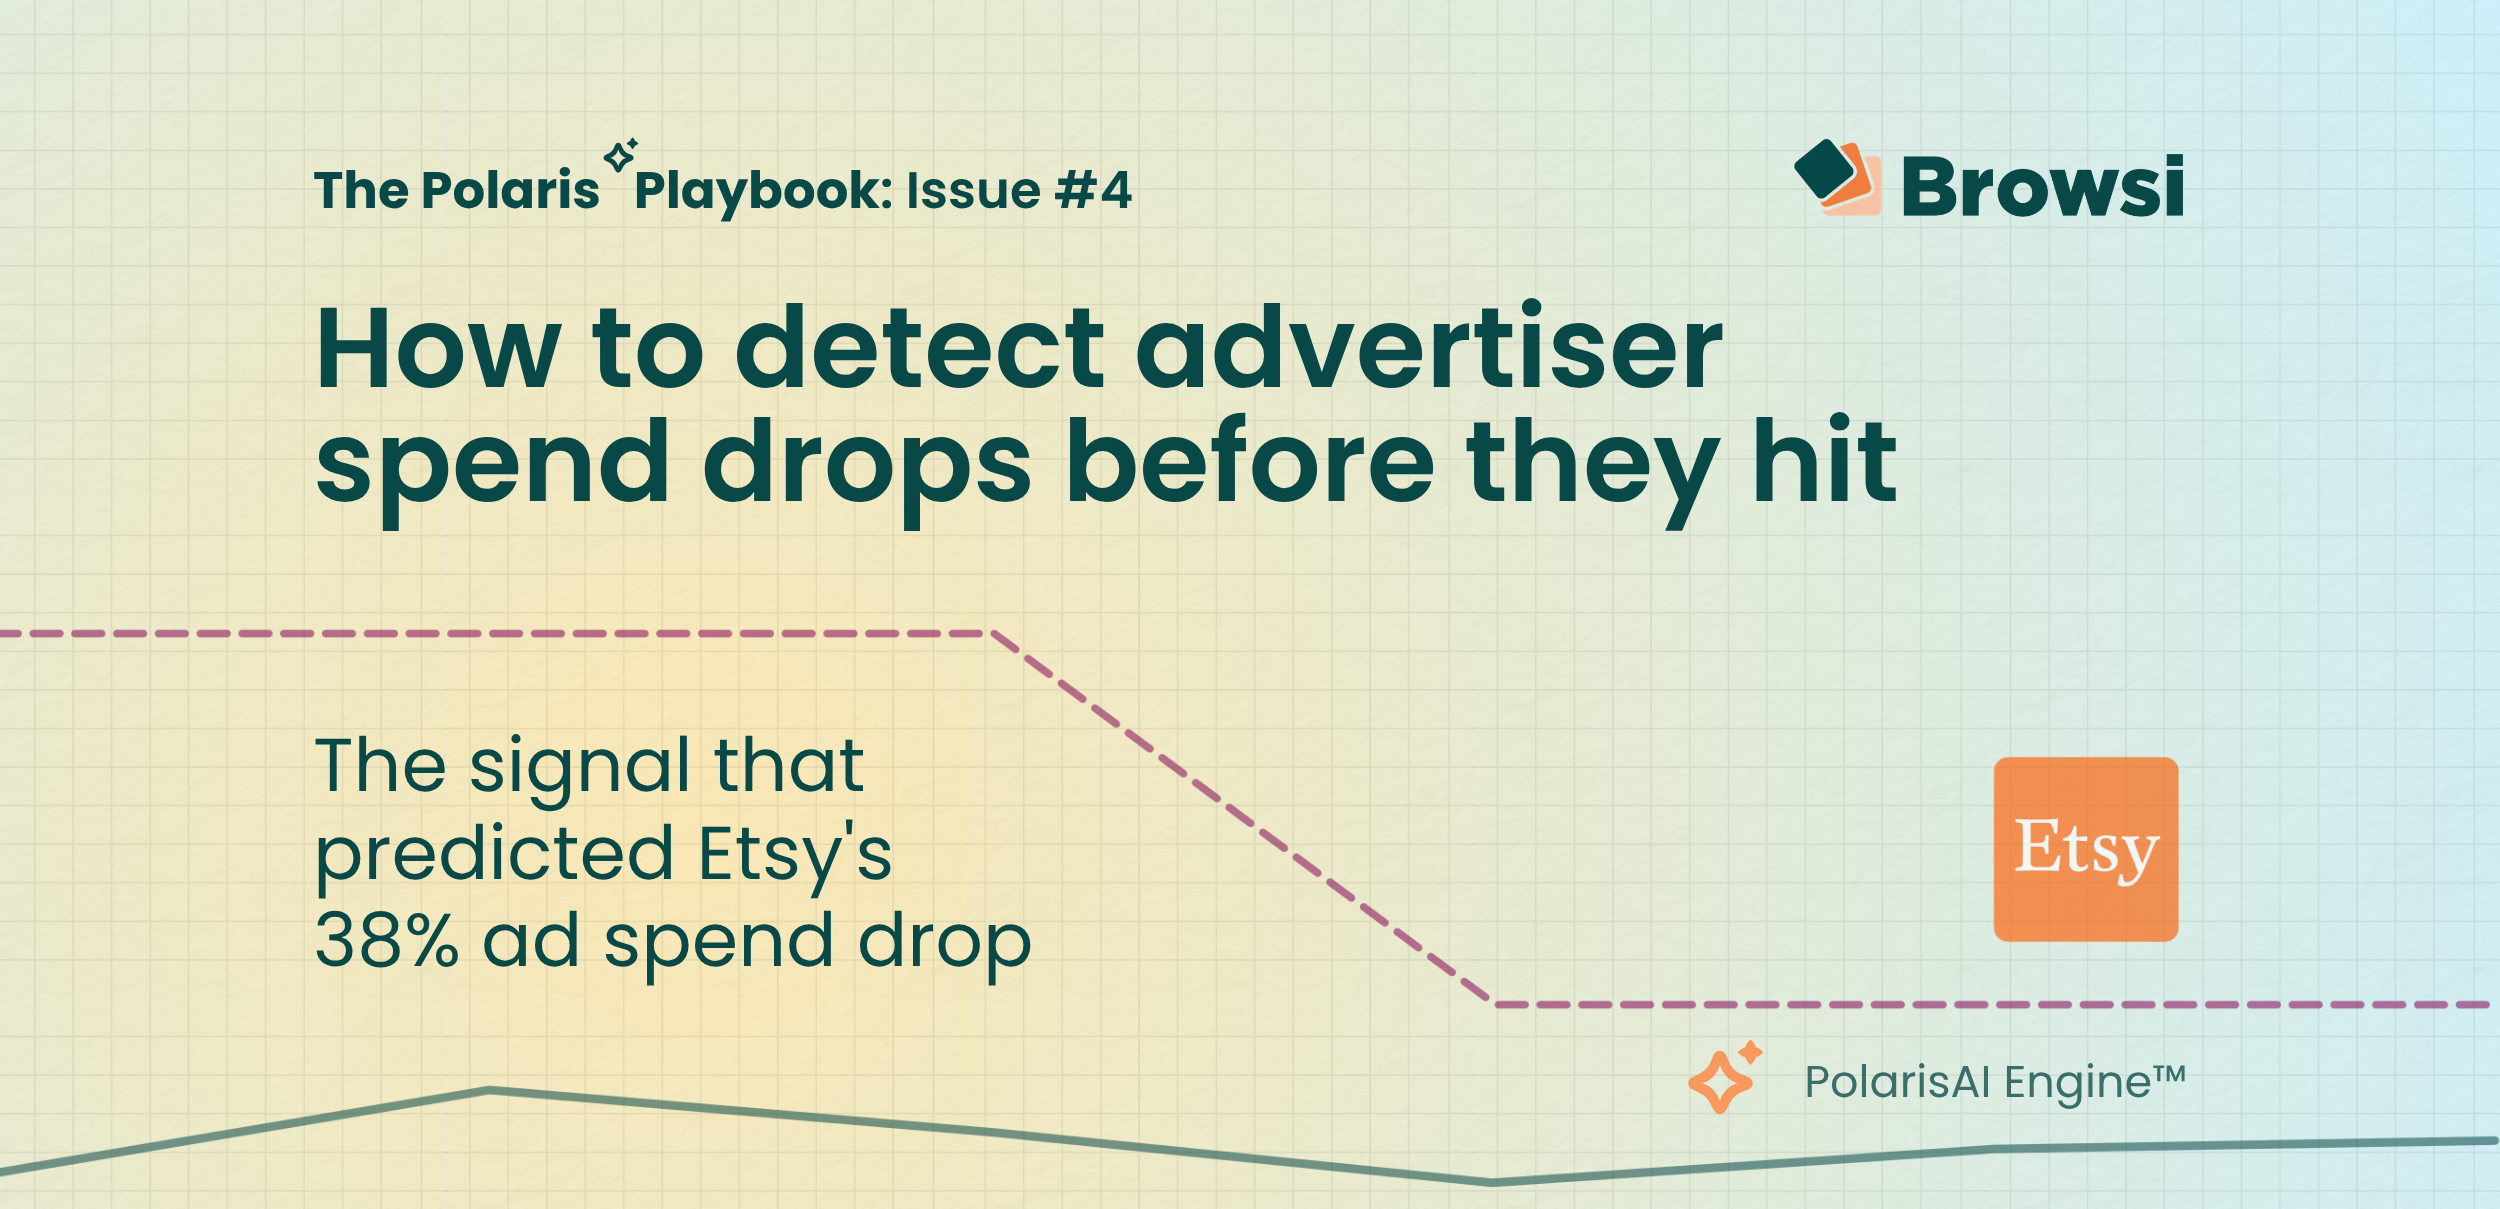
How to Detect Advertiser Spend Drops Before They Hit
Etsy's earnings confirmed what PolarisAI had already seen: a major pullback in marketing investment. By analyzing competitive signals before quarterly results were released, PolarisAI projected a 38% decline in spend while the market was still reacting to the underlying changes. The result highlights a growing reality for marketers: the most valuable competitive insights often emerge long before earnings calls explain them.
View Now -

How Accurate is Browsi’s Data? Tried and Tested.
Most marketers trust competitive spend data without questioning where the numbers come from. We tested PolarisAI Engine™ against the only benchmark that matters: what advertisers actually reported in their earnings calls. The result was an 87% correlation across five major brands, revealing the difference between data that looks confident and data grounded in reality.
View Now