Your Brand New Viewability Dashboard!
By Browsi | October 18, 2022
Understand your inventory breakdown with the new Viewability Dashboard.
You can now easily use the Viewability Prediction Dashboard to identify your quality tiers per specific metrics and allocate and price your inventory accordingly.
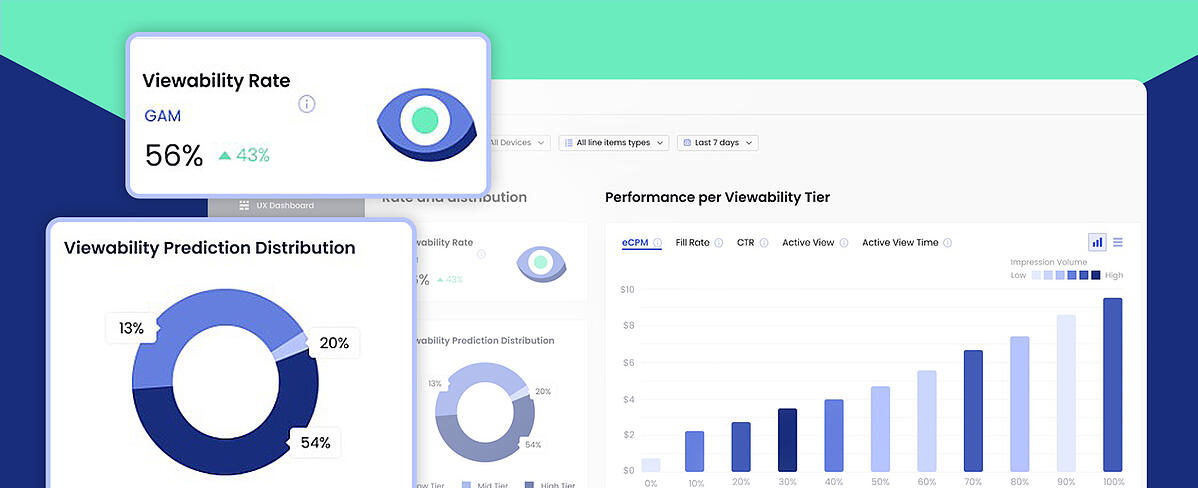
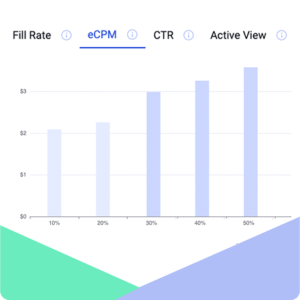 Analyze your performance per viewability tier
See how your fill rate, eCPM and CTR correlate with your different viewability tiers. Identify your inventory’s granular value to set a more accurate pricing.
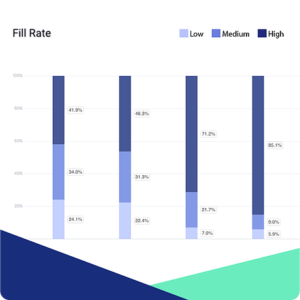 Review your line item type viewability prediction share
Deep dive into your revenue data from all types of providers to find out which one is performing better and leverage these insights to improve your ad revenue.
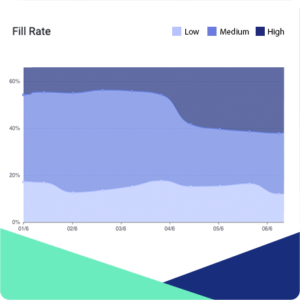 Follow your viewability prediction share over time
Monitor the shift in your inventory between the viewability tiers over time and trace back the impact of Browsi’s engine and viewability optimization on your viewability.
Looking for insights on how to identify quality tiers and price your inventory accordingly?
Let’s schedule a 15-min call to walk you through our Viewability Prediction Dashboard and how to keep your inventory waste to a minimum!
Latest Articles
-

Why Ad Tech Might Be Missing the Target: The Blind Spot OpenTTD Reveals
The Trade Desk’s OpenTTD highlights a shift in ad tech as advertising platforms evolve into larger ecosystems. While this consolidation simplifies media buying workflows, it can also create a blind spot, limiting visibility into the broader competitive landscape shaping programmatic advertising.
View Now -

The Doctor Everyone’s Seeing: YouTube, AI Search, and the New Rules of Visibility
Google’s AI Overviews are reshaping discovery by deciding which sources appear in answers — often before users ever click. As search shifts from clicks to citations, traditional performance metrics no longer tell the full story. This article explores what visibility really means in an AI-mediated web, and why competitive intelligence is now essential.
View Now -

The Vanishing Web: What Google’s Admission Really Means for Advertisers
For years, Google insisted the open web was thriving. Then, in a legal filing, it admitted the opposite. For advertisers, the real risk isn’t where ads run, but how much of what happens around them can still be seen, understood, and measured.
View Now