Maximize Your UX & Revenue Data With Personalized Reports
By Browsi | October 18, 2022
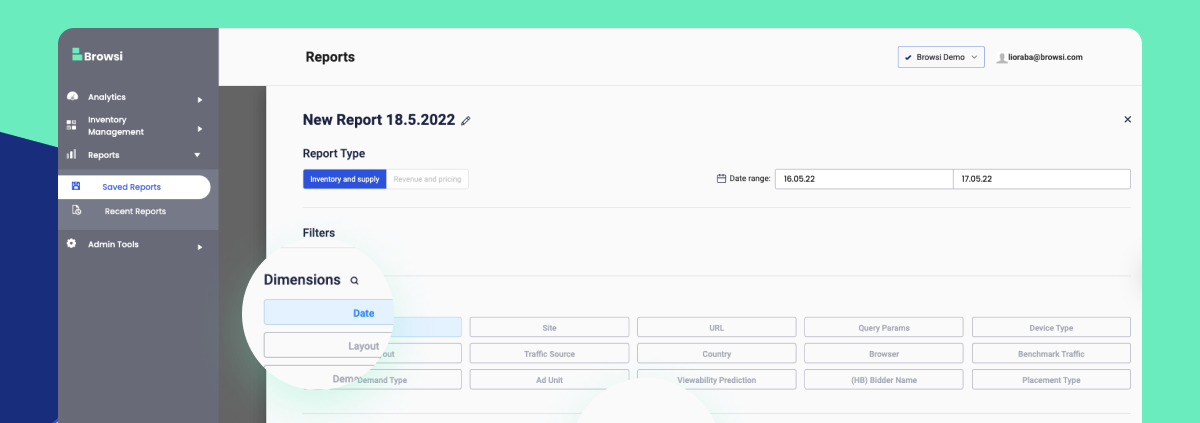
The Browsi query tool provides a personalized reporting system that enables full adjustment to your unique needs.
Filter, customize and automate scheduled reports based on unique metrics combinations and uncover insights to maximize your ad stack.
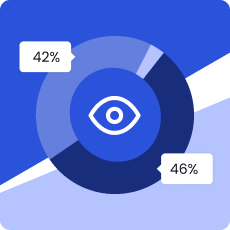 Optimize Your Viewability
Break down your viewability rate per ad layout or even per ad unit to uncover exactly which ad layout or ad unit is dragging your average down.
 Analyze Your Demand Funnel
Deep dive into your revenue data from all types of providers to find out which one is performing better and leverage these insights to improve your ad revenue.
 Investigate Your Page & Engagement
See how your users engage with different ad layouts and identify where most of your pageviews are coming from (device types, traffic sources and more).
Ready to uncover insights and step up your ad layout strategy?
Let’s schedule a 15-min call to walk you through our robust reporting system and evaluate how unleashing AI behind your digital real estate can help you grow your revenue and improve your UX.
Latest Articles
-
We Now Know What Ad Was Served. We Still Don’t Know if it Mattered.
The IAB’s new ACIF standard brings much-needed structure to creative asset tracking in programmatic advertising. It’s a meaningful step — but knowing what was served isn’t the same as knowing if it mattered. This piece explores what ACIF fixes, what it doesn’t, and why understanding the experience of an ad is key to measuring true impact.
View Now -

When Budgets Shrink, Transparency Becomes Power
Today’s media teams aren’t just asked to drive results; they’re asked to defend them. In a market where ad budgets are under the microscope and every dollar must prove its worth, clarity and efficiency win. It’s no longer about spending more — it’s about spending smarter. The brands that can surface waste, double down on what works, and adapt in real time will be the ones that thrive in this new media economy.
View Now -

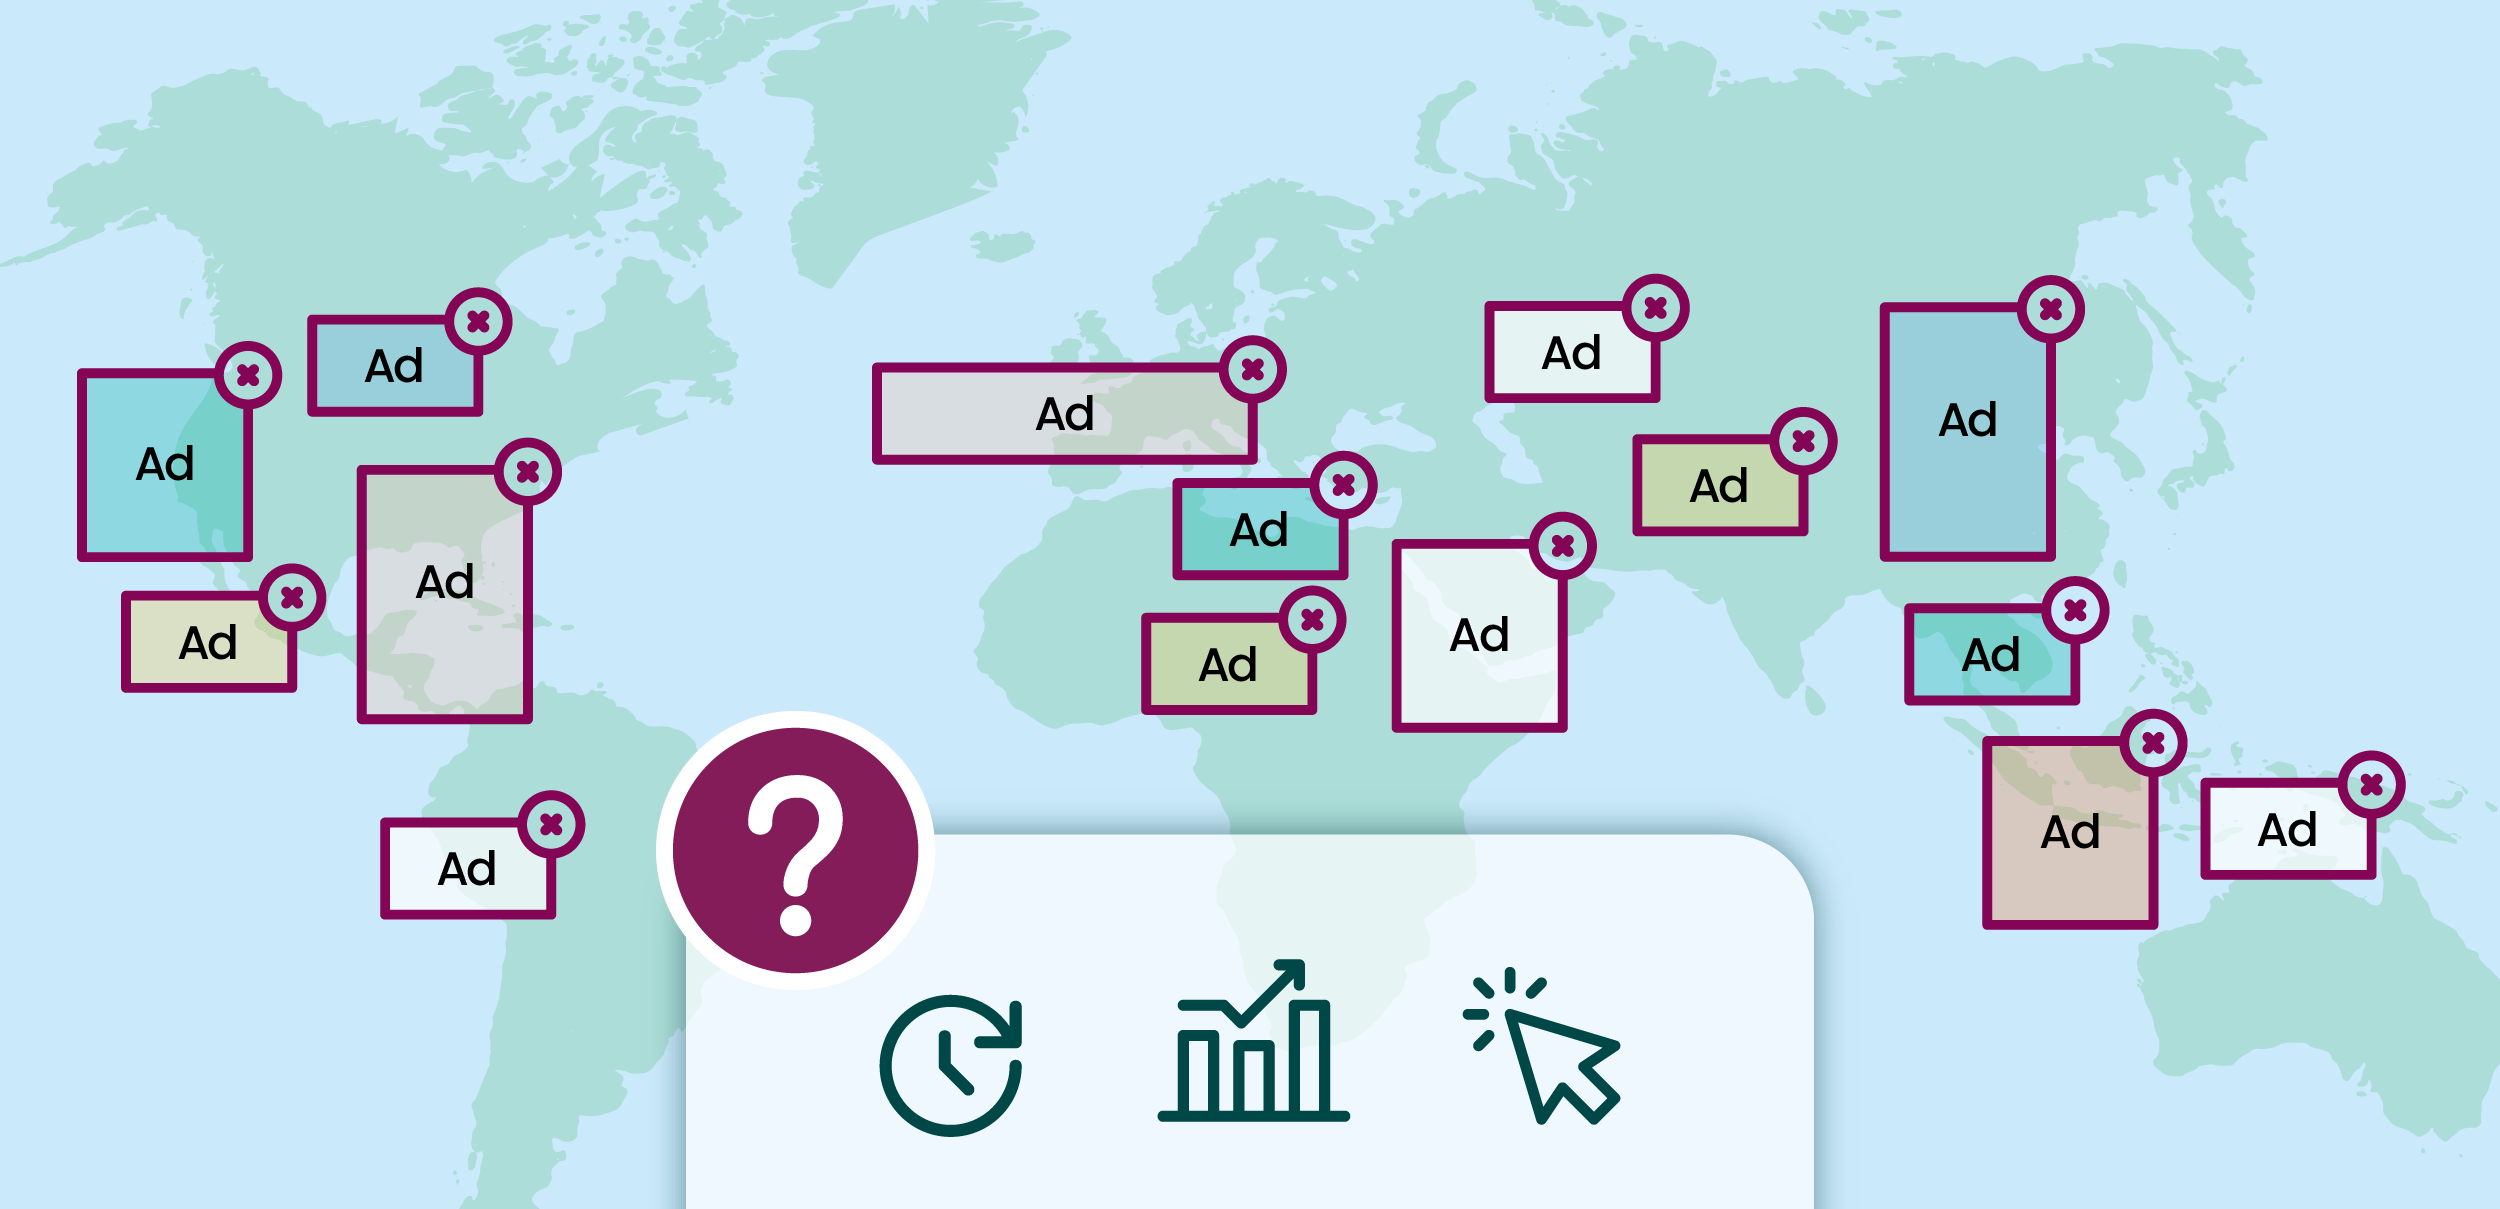
In Real-Estate and in AdTech – Location is (Almost) Everything
You can have the best ad in the world - high-performing creative, long time in view, shown to an engaged user. But if it’s squeezed between seven other ads on a cluttered page? It’s not going to land. That’s the part we don’t talk about enough. The environment. The layout. The density. The visual noise around the impression. Let’s talk about two under appreciated KPIs that shape that environment.
View Now