How Accurate is Browsi’s Data? Tried and Tested.
By Asaf Shamly | May 27, 2026

Marketers are used to black-boxes.
If you’ve worked with competitive spend data, you know the uncomfortable truth: most tools give you a number and there’s no way to check it.
No external benchmark. No stated accuracy.
The confidence in that number comes from how it’s presented. And yet, most marketers will question everything else: the creative, the placement, the bid strategy. But the data underneath all of it? Far fewer do.
Marketers have been taught to trust the system – not because the data proved itself, but because it’s the foundation everything else is built on.
Confidence isn’t the same as accuracy.
There’s a version of competitive intelligence that looks rigorous but isn’t. And a version of internal measurement that’s accepted as “good enough,” even when better data exists.
Still, none of that tells you whether the number is right. It just tells you the tool is well designed. So for this issue of the Polaris Playbook, I put ours to the test.
We took PolarisAI Engine™ data across five major advertisers and compared it against the only benchmark that can’t be gamed: what those companies actually reported spending in their earnings calls.
Most competitive tools start with a proxy signal.
Majority of competitive tools observe a small slice of behavior and fill in the rest with assumptions.
PolarisAI doesn’t do that. It builds a full-channel view of what’s actually happening across display, social, video, and beyond based on real, observed ad activity.
Not inferred. Not smoothed. Not lagged behind the market.
Just real activity, which means when we test it, we’re not comparing estimates to estimates. We’re comparing our data to reality.
Now for the test…
The setup was straightforward and intentionally so.
We took PolarisAI Engine™ data for five major advertisers: Expedia, Booking Holdings, Instacart, Wayfair, and Etsy across six months of real activity in H2 2024.
Then we compared every single data point against what those companies reported in their Q3 and Q4 earnings calls. To keep the comparison clean, the H2 data was built using only baselines from H1. No H2 earnings figures were used in the data itself. The comparison was entirely independent.

The result: 87% correlation with reported earnings
Every data point in the chart below is a Polaris reading against what the company actually reported, completely independent.
Not every point lands perfectly on the line. That’s expected. Real data has noise. What matters is the signal. And here, it’s strong. Strong enough to produce an 87% correlation across five different advertisers, in five distinct verticals.

Brand-by-brand accuracy
The cross-brand number is the headline. But accuracy varies by brand, which reflects how consistent each advertiser’s spend behavior is, and how comprehensively PolarisAI covers their channels.


87% accuracy in practice
What does this level of correlation demonstrate? PolarisAI reflects when a brand significantly increases spend, before earnings calls confirm it. When a brand pulls back, you’ll see that too.

This is what data accuracy looks like in practice: the ability to act on what’s happening now, not what someone reports three months later.
Because if the data is wrong, every decision built on top of it is too.
What this reveals about other tools
There are a lot of competitive spend tools. Most can’t validate whether their estimates reflect what’s actually happening in the market right now. Instead, many rely on modeled assumptions, panel-based estimates, or historical reporting that appears long after strategic decisions have already been made.
PolarisAI is different. We tested it against what advertisers themselves reported and it matched at an 87% correlation.
That changes the conversation from “there’s a competitive spend estimate” to “here’s what your competitors are actually doing.”

The bottom line?
We didn’t run this test to convince any one of anything – the graphs do most of the talking. And I’m not sharing this because 87% is perfect either. It isn’t.
I’m sharing it because it’s real. Independently grounded in what advertisers actually report. And that tells you more about the quality of the data than any claim ever could.
Most tools ask you to trust the number. They don’t give you a way to check it. This does.
And that’s the difference between confidence and accuracy
Latest Articles
-
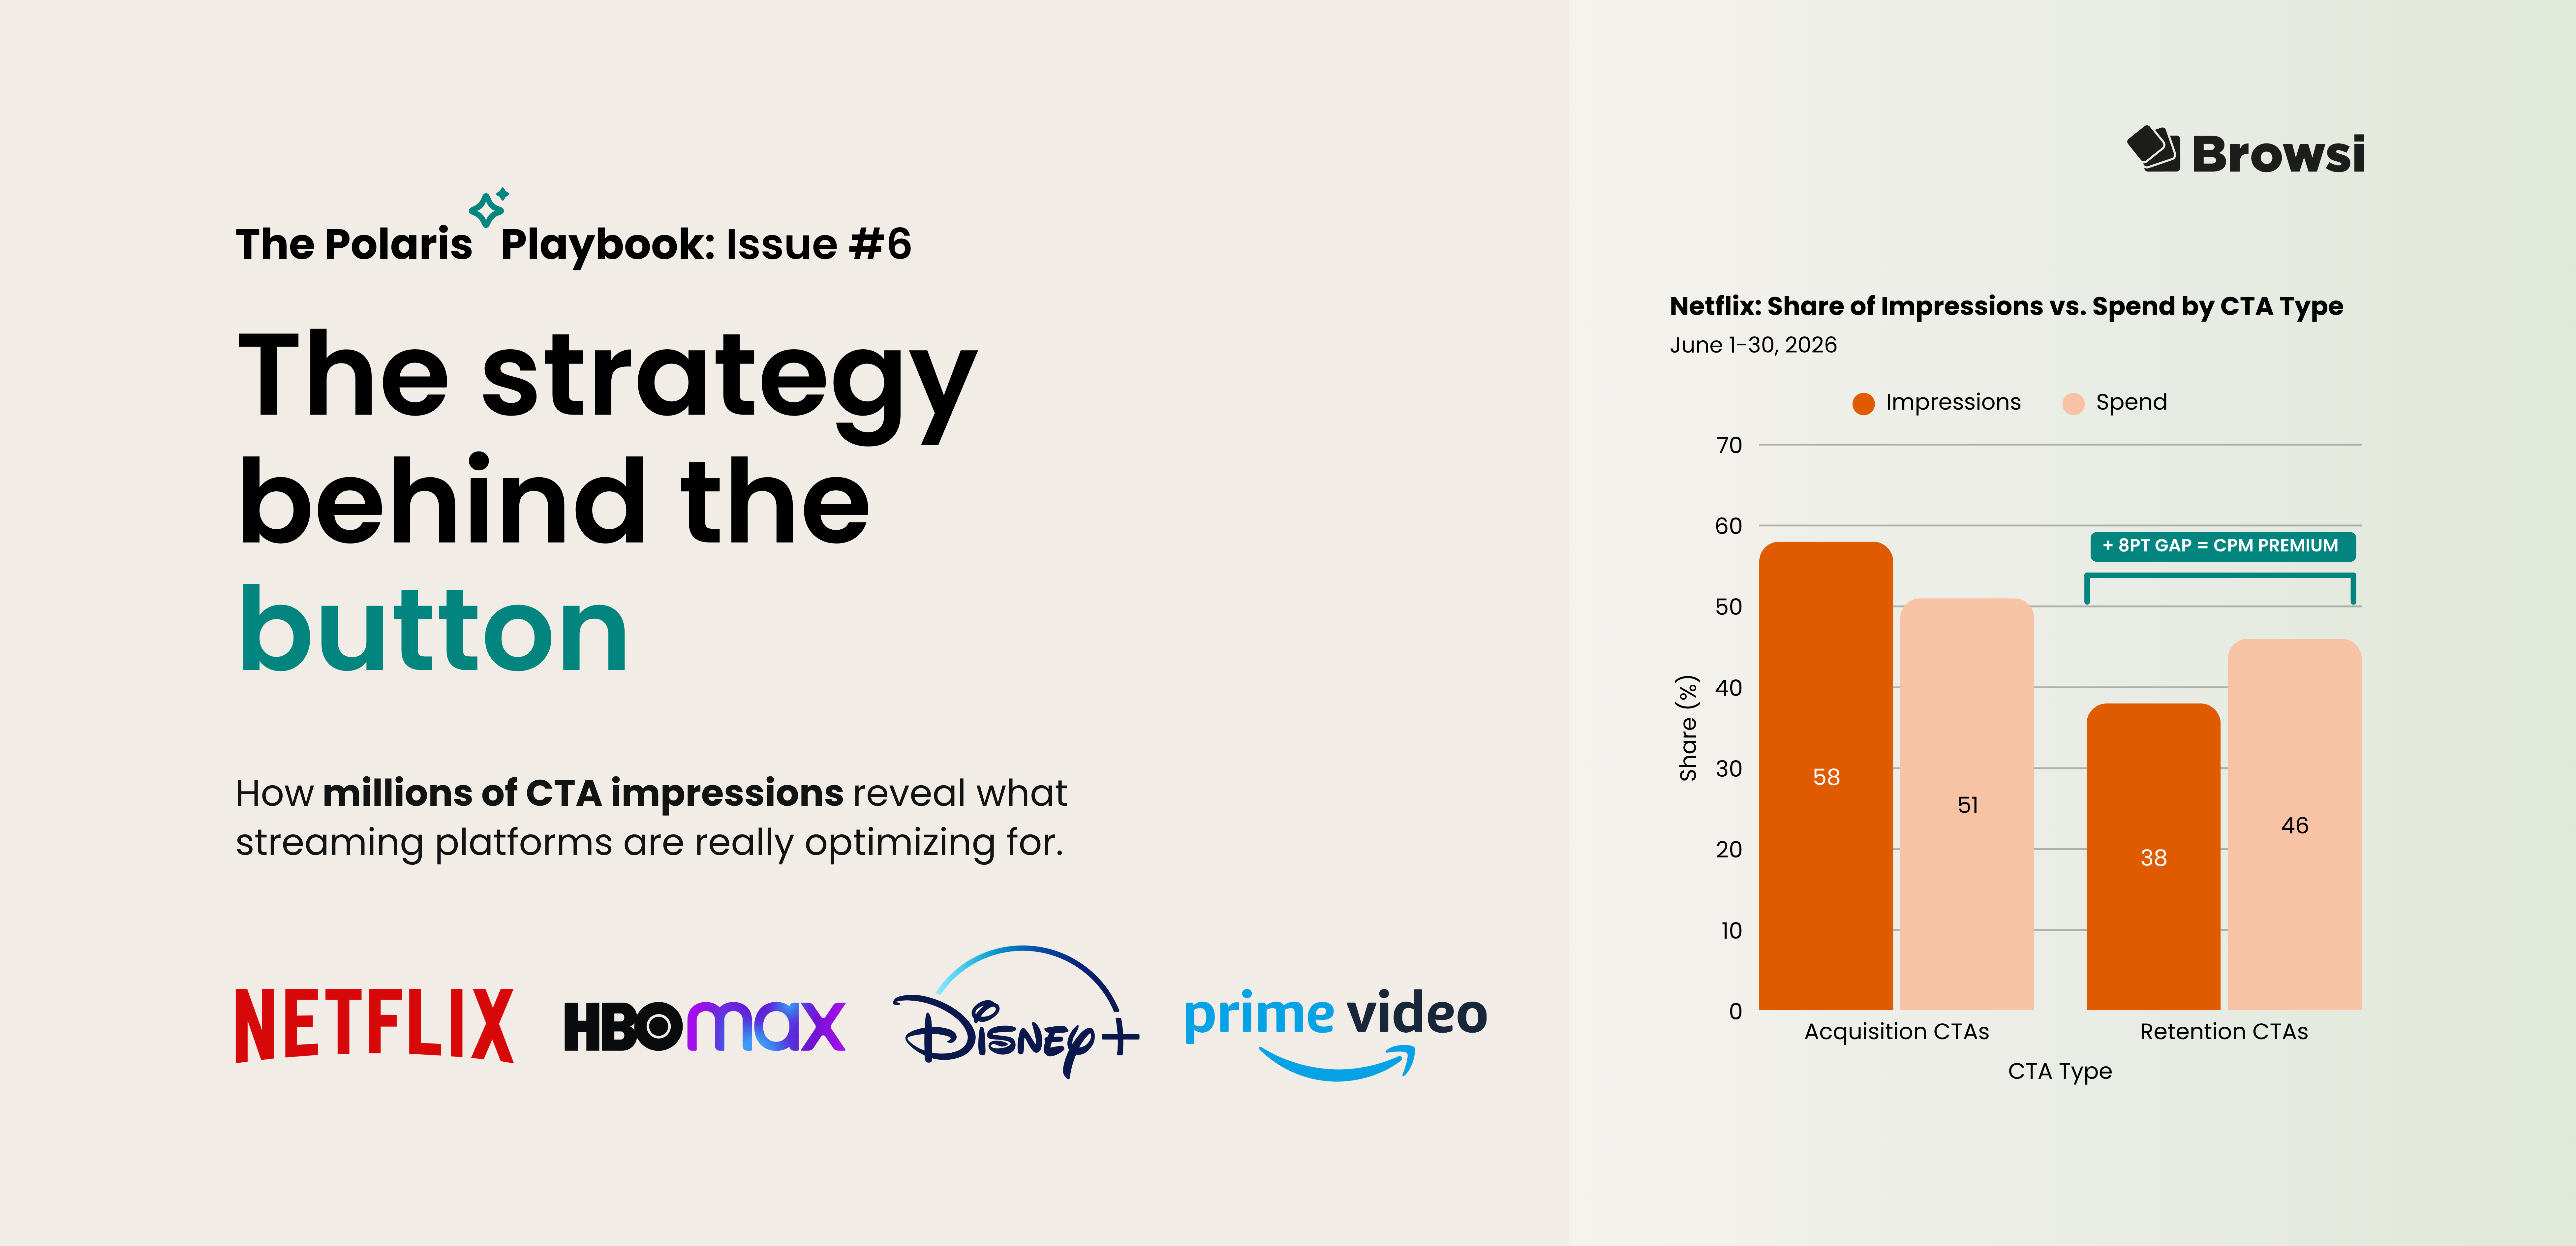
The strategy behind the button: What millions of CTA impressions reveal about competitive strategy
What can a single CTA button reveal about a company's marketing strategy? By analyzing millions of Meta ad impressions, PolarisAI uncovers how Netflix, Prime Video, HBO Max, and Disney+ use "Sign Up," "Watch More," and other CTAs to prioritize subscriber acquisition, viewer engagement, and broader competitive strategy.
View Now -

The 6-step framework for turning signals into strategy
Competitive intelligence only matters if it leads to action. In this edition of The Polaris Playbook, we use Honda and five competitors to demonstrate a practical six-step framework for turning competitive signals into strategic recommendations marketers can actually use.
View Now -
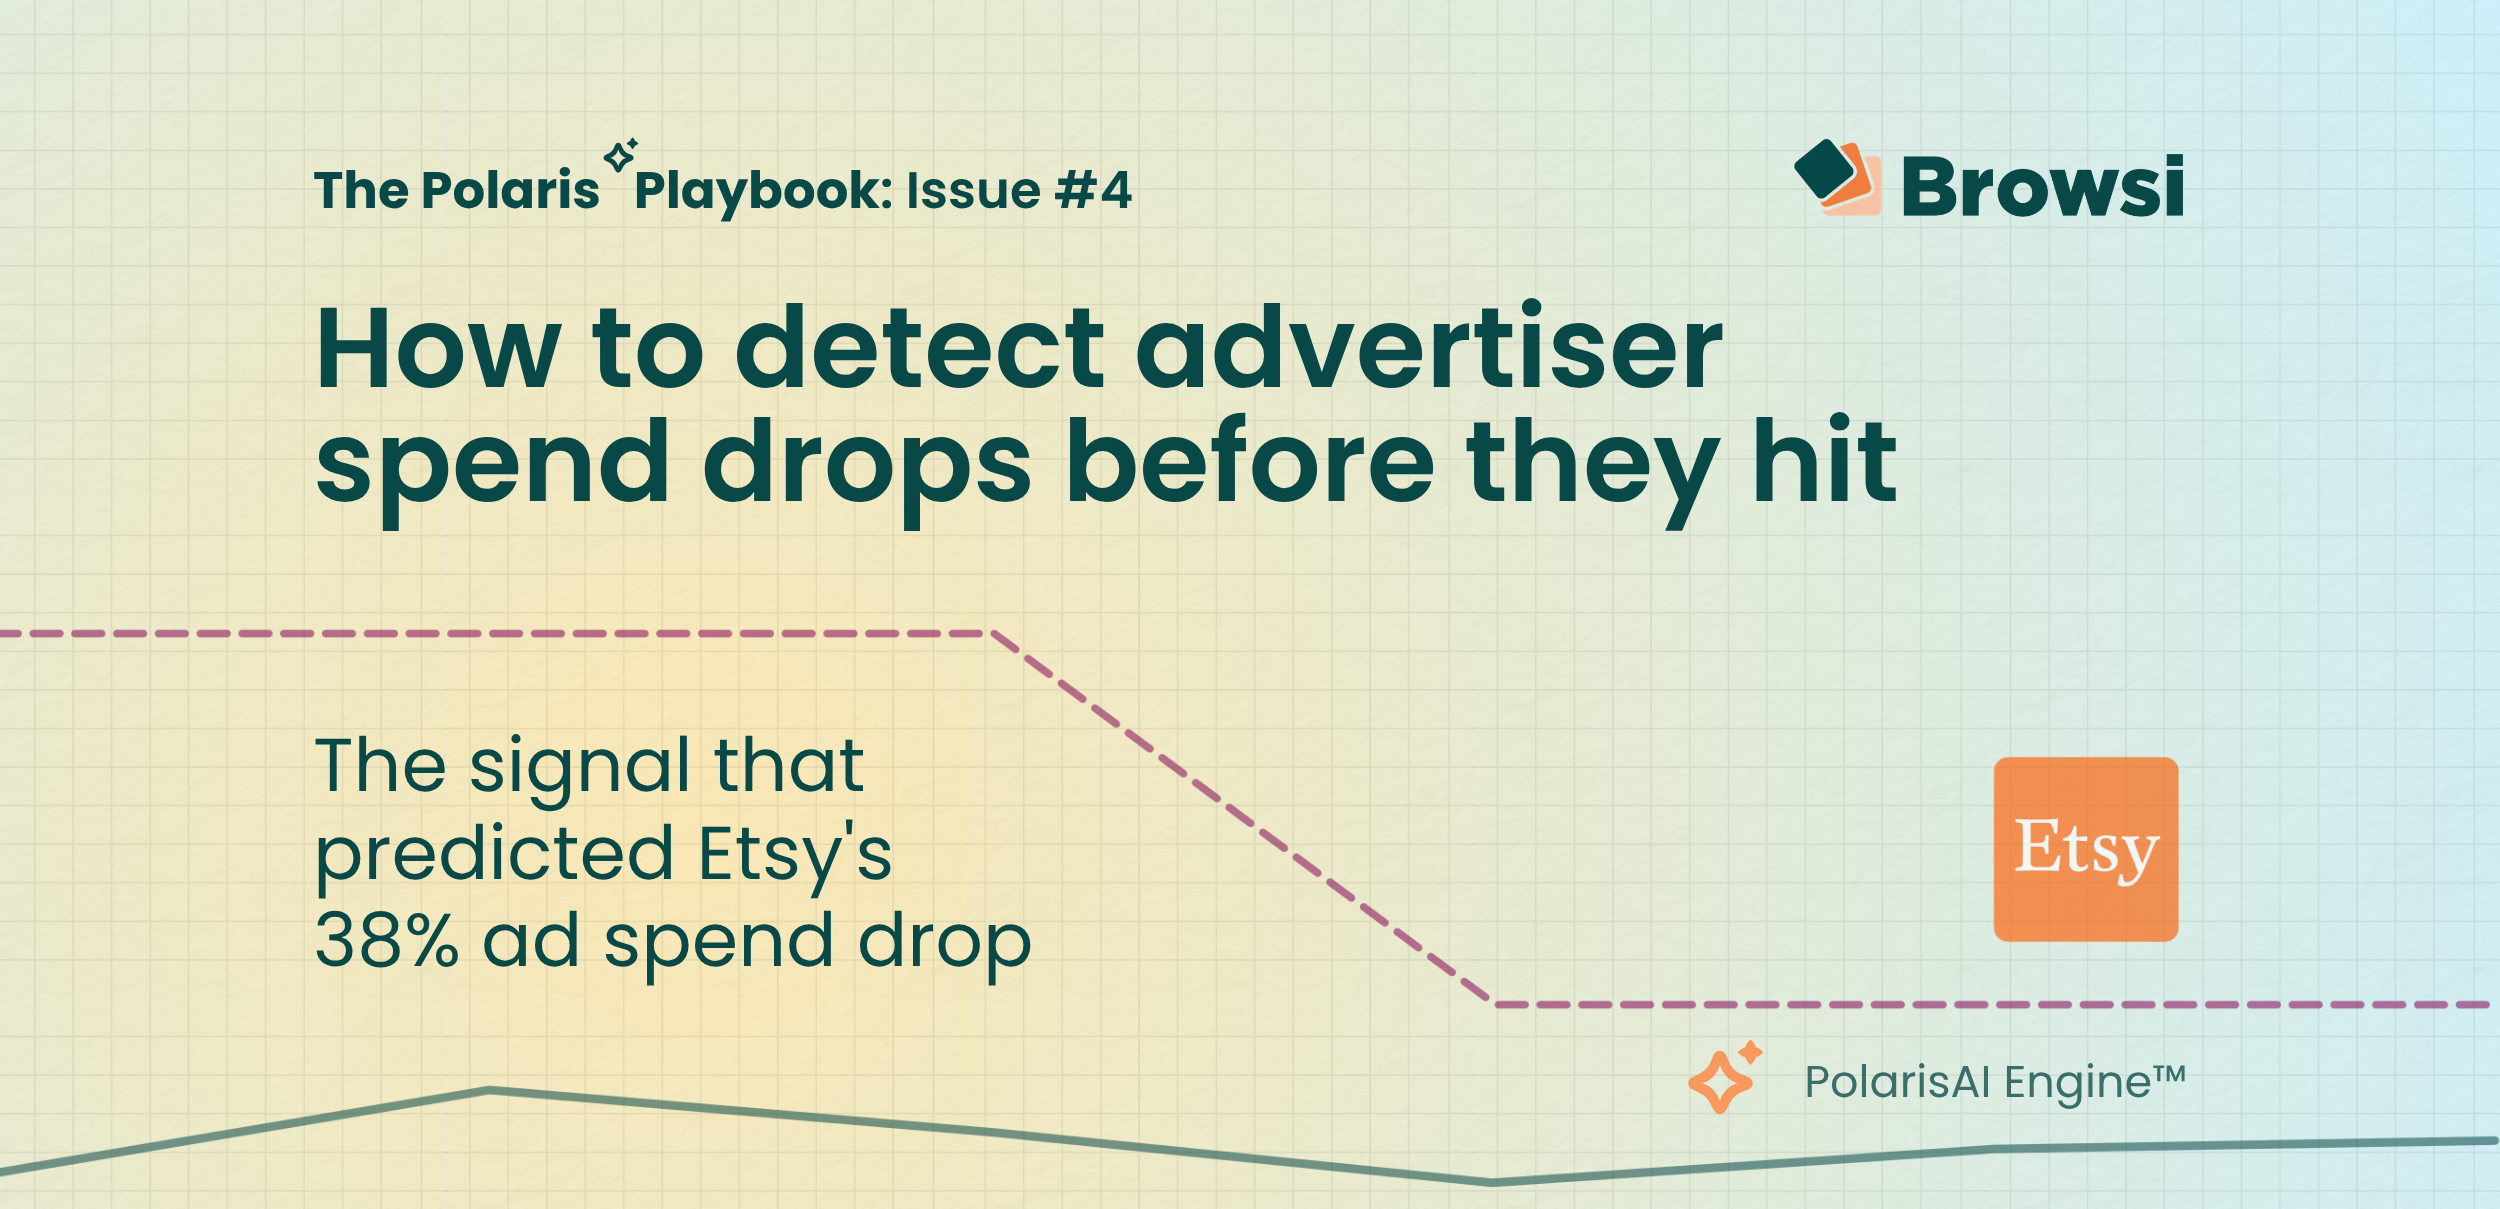
How to Detect Advertiser Spend Drops Before They Hit
Etsy's earnings confirmed what PolarisAI had already seen: a major pullback in marketing investment. By analyzing competitive signals before quarterly results were released, PolarisAI projected a 38% decline in spend while the market was still reacting to the underlying changes. The result highlights a growing reality for marketers: the most valuable competitive insights often emerge long before earnings calls explain them.
View Now