The 6-step framework for turning signals into strategy
By Asaf Shamly | June 18, 2026
You open your competitive intelligence platform, pull up a dashboard, and are met with dozens of charts, creatives, spend estimates, and performance metrics. When everything appears worth investigating, deciding where to focus becomes a real challenge.
How do you distinguish meaningful signals from background noise? Which competitors warrant a closer look? Are you seeing a genuine market shift or a temporary fluctuation? And once you’ve identified something worth investigating, what should you do next?
In this issue of the Playbook, I’ll use Honda and its competitors to demonstrate how a structured approach can turn competitive intelligence from an overwhelming collection of signals into clear strategic direction.
Using PolarisAI‘s open web and social dashboards as our guide, we’ll identify a signal, validate it, understand whether it represents a broader pattern, and turn it into a strategic recommendation.
Step 1: Your position in 30 seconds
Open PolarisAI and you’ll see two environments to work with: open web and social.
I like to start with open web because it provides a useful baseline. CPM, TruAttention™, and placement efficiency interact in ways that aren’t always obvious at first glance, and understanding those relationships makes it easier to interpret what you’re seeing across channels later.
For this example, I chose five other major car brands to sit alongside Honda: Ford Motor Company, Chevrolet, Toyota Motor Corporation, Hyundai Motor Company, and Subaru Corporation. Before diving into individual creatives or spend trends, I want to understand how the category is behaving as a whole.
The Overview surfaces the signals that deserve a second look. Everything else helps explain why they’re happening.

Honda’s CPM is 32% lower than competitors. In most categories, paying less per impression would be a sign of efficiency. Here, it’s actually the first red flag. Paired with that low CPM, Honda’s TruAttention™ trails the category by 19% and CTR is down 31%.
Looking at CPM and attention together reveals the underlying pattern:
Honda is achieving low media costs while attracting lower-quality attention. That reframes everything downstream.
If the problem were spend or reach, the solution would be budget. But if the problem is inventory quality, more budget directed at the same placements only scales the inefficiency.
The question now becomes: what can we learn from our competitors?
Step 2: Who’s driving clicks?

The Creative Gallery defaults to Impressions (Descending), showing what’s being served most frequently. Switch the sort to CTR (Descending), and the focus shifts to what is actually persuading users to act. The pattern is immediate.
Toyota occupies six of the eight top positions. Hyundai holds the remaining two. Honda doesn’t appear once.
Toyota’s top performers achieve CTRs between 1.37% and 1.40% at CPMs ranging from $0.38 to $0.42. Hyundai’s Kauai EV creative delivers a 1.36% CTR at a $0.53 CPM.
The brands generating the strongest click response aren’t paying a premium for it. That points away from a budget problem and toward a quality one — which is exactly what the Spend Analysis helps clarify.
Step 3: Compare spend to outcomes

At this point, a few signals have emerged:
– Honda’s CPM is the lowest in the category.
– Its attention and CTR scores trail competitors.
– Toyota and Hyundai dominate the highest-performing creatives.
The Two-Factor Analysis brings those signals together.
Honda sits at approximately $2M in estimated spend with a 27% TruAttention™ score. Subaru operates at a similar spend level while achieving 41% TruAttention.
The same story holds when you switch the axes to CPM versus CTR, except the question shifts from how much each brand is spending to how much they’re getting for it. Toyota sits slightly higher at approximately $1.30 CPM while generating a 0.15% CTR. Honda delivers around 0.09% CTR at a similar cost.
The relationship between spend and outcomes suggests that quality, execution, and placement deserve a closer look.
Step 4: Is this a pattern or a moment?

The Performance Over Time chart tracks how these positions evolve over the last 30 days.
Chevrolet and Subaru remain within the 38–45% TruAttention™ range throughout the period, with Chevrolet gradually trending upward and closing near 45%.
Honda spends most of the month between 24% and 28% before declining to approximately 21% by June 14. Over time, the gap between Honda and the category’s stronger performers becomes increasingly pronounced.
Hyundai also experiences a sharp decline during the final week of the period. Honda’s movement unfolds more gradually across the month, suggesting a sustained pattern rather than a short-term fluctuation.
Honda’s open web attention quality remains below the category average throughout the period, and the downward trajectory reinforces the signals surfaced earlier in the analysis.
Step 5: What does social tell us?
Every signal so far has come from the open web. The next question is whether the same story appears across social.
On social, Honda holds 24% share of voice, nearly triple its 10% open web SoV. The brand spends 40% more than competitors and generates 58% more impressions, while maintaining a CPM 11% below the category average.

Honda’s social footprint is substantial.
Ford accounts for 38% of open web spend and 19% of social share of voice. Chevrolet’s presence remains relatively stable across channels. Honda’s share expands considerably on social. The distribution of activity suggests a deliberate channel allocation strategy.
At the same time, reach and share of voice only describe scale. The top social creatives in the category, ranked by impressions, don’t feature Honda either. The brand is reaching a large audience, but the relationship between that reach and meaningful engagement remains unclear.
Where is the quality gap actually coming from?
Step 6: Turn the signal into a strategy

By this point, we’ve moved from a dashboard full of metrics to a working hypothesis.
Honda appears to have concentrated investment on social media while maintaining a smaller open web footprint. Open web performance continues to lag on attention and CTR, while social investment has generated scale without clear evidence of stronger engagement.
This is where PolarisAI changes the workflow.
Rather than manually investigating every possible explanation, Polaris evaluates the evidence surfaced throughout the analysis and identifies the patterns most likely driving performance.
In Honda’s case, three findings stood out:
– The low CPM is a trap, not an advantage. Honda’s CPM is the cheapest in a category but it comes with the weakest TruAttention and CTR in the set. Cheap impressions that don’t hold attention or drive clicks represent poor value, not smart buying.
– The attention decline is structural, not cyclical. Honda opened the 30-day window already below the category average of 31.0% TruAttention™. They closed at 20.8% while the category held steady. The gap widened from 3 points to nearly 8 points over the period.
– On social, Honda is spending heavily but inefficiently. Honda accounts for 18.8% of category social spend but only 17.7% of impressions. Nissan achieves 26.1% of impressions on 13.9% of spend. Honda’s top creatives span three markets with no unifying theme, and a passive “Like Page” format among the top reach drivers suggests the investment isn’t concentrated where engagement is strongest.
The takeaway
Taken together, these findings point toward a clear strategic direction.
Improving performance will require greater discipline across both channels: prioritizing higher-attention inventory on the open web and consolidating social investment behind fewer, stronger creative ideas. Otherwise, lower media costs and larger reach figures may continue to obscure a broader issue with the quality of audience engagement.
Competitive intelligence is most valuable when it changes the decisions you make. I hope this framework helps you get there. If you’re exploring PolarisAI through the free trial, I’d love to hear what insights you uncover.
Latest Articles
-
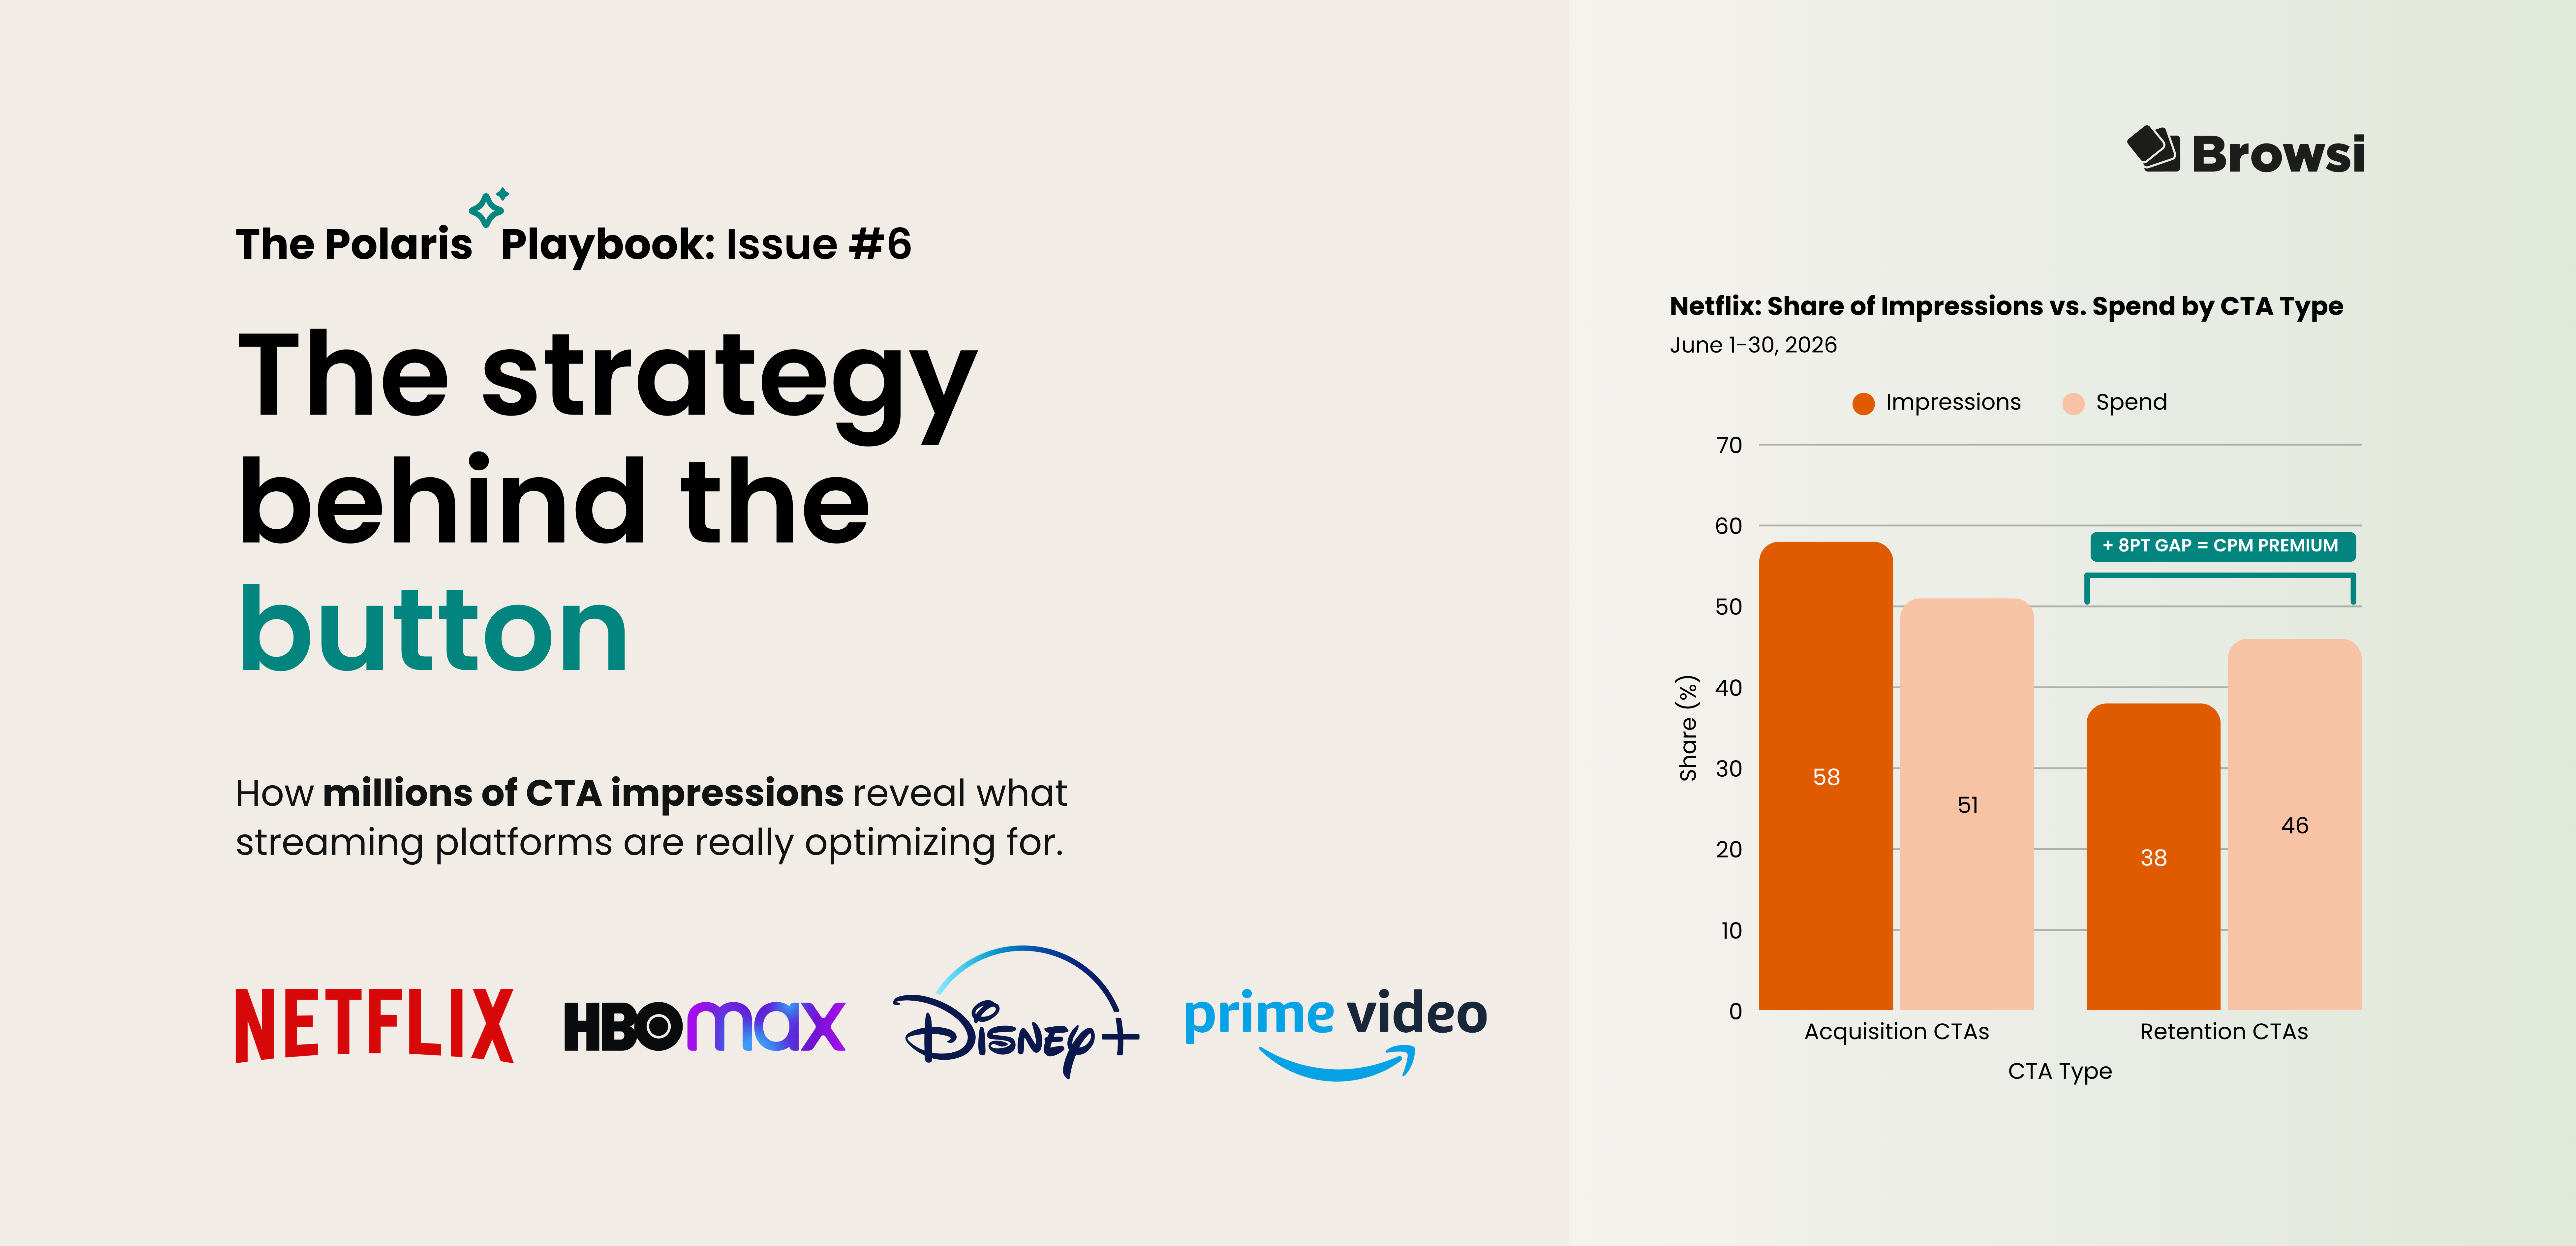
The strategy behind the button: What millions of CTA impressions reveal about competitive strategy
What can a single CTA button reveal about a company's marketing strategy? By analyzing millions of Meta ad impressions, PolarisAI uncovers how Netflix, Prime Video, HBO Max, and Disney+ use "Sign Up," "Watch More," and other CTAs to prioritize subscriber acquisition, viewer engagement, and broader competitive strategy.
View Now -
How to Detect Advertiser Spend Drops Before They Hit
Etsy's earnings confirmed what PolarisAI had already seen: a major pullback in marketing investment. By analyzing competitive signals before quarterly results were released, PolarisAI projected a 38% decline in spend while the market was still reacting to the underlying changes. The result highlights a growing reality for marketers: the most valuable competitive insights often emerge long before earnings calls explain them.
View Now -

How Accurate is Browsi’s Data? Tried and Tested.
Most marketers trust competitive spend data without questioning where the numbers come from. We tested PolarisAI Engine™ against the only benchmark that matters: what advertisers actually reported in their earnings calls. The result was an 87% correlation across five major brands, revealing the difference between data that looks confident and data grounded in reality.
View Now