How to Detect Advertiser Spend Drops Before They Hit
By Asaf Shamly | June 4, 2026
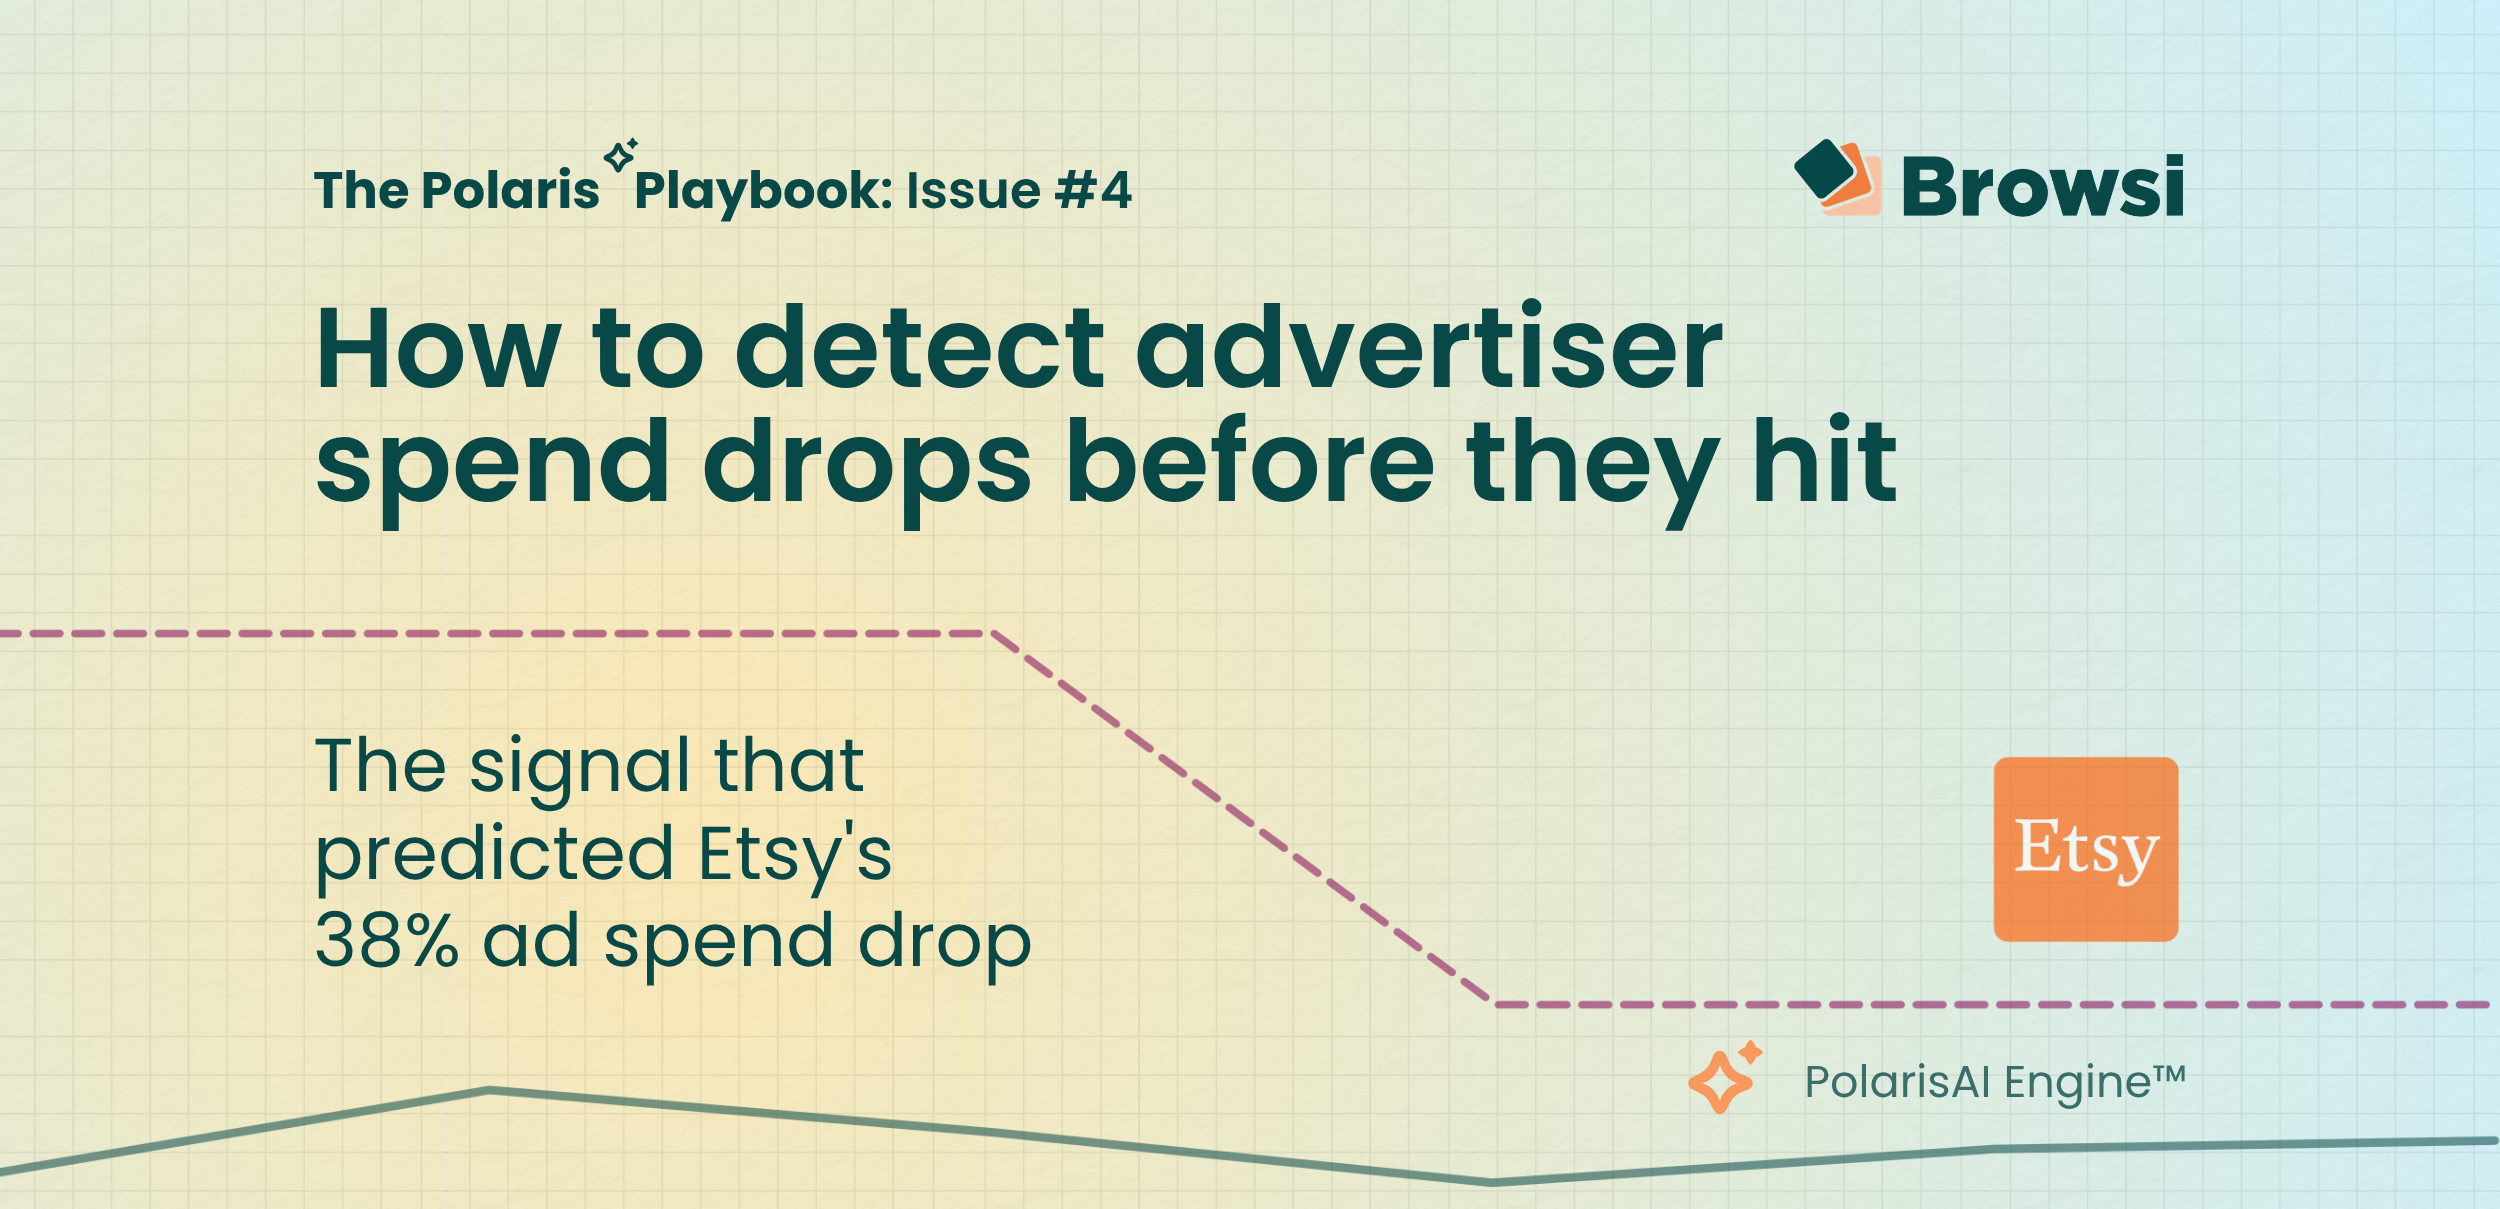
The PolarisAI Signal that predicted Etsy’s 38% ad spend drop before anyone else knew
Every earnings season follows the same pattern.
Public companies report quarterly performance, analysts dissect the numbers, and competitors try to piece together where the market is moving next.
By the time those signals become public, the underlying shifts in spend and strategy have already happened, creating a major blind spot for marketers trying to understand competitive pressure in real time.
Solving that gap has always been one of the core ideas behind PolarisAI.
In one of the last issues of The POLARIS Playbook, we validated our data against publicly reported earnings data (with an r = 0.87 correlation), and one signal stood out immediately: Etsy’s marketing activity was declining sharply weeks before the company reported its results.
I wasn’t looking at competitive intelligence as a historical reporting layer. I was looking at a signal that reflected where the market was moving before earnings made it public.
In other words, it wasn’t just explaining the past. It was predicting the future.
Here’s what the signal showed

Going into Q1 2026, PolarisAI Engine™ data on Etsy was showing a sustained decline in marketing activity relative to Q4 2025 levels.
The movement was not isolated to a single campaign or seasonal fluctuation. Following Etsy’s elevated holiday activity in November, spend pressure eased consistently through December, January, and February.
Just look at the difference between the two curves in the figure below:

The reported spend line starts relatively flat because quarterly earnings only reveal a summarized view of spend after the quarter has already ended.
The PolarisAI Engine™ signal, on the other hand, captures how spend actually moved throughout the quarter, including Etsy’s November holiday spike, followed by a sustained pullback into Q1 2026.
That pullback was strong enough that, by the end of the quarter, the signal was projecting an approximate 38% decline in Etsy’s reported marketing spend relative to Q4 2025 levels.
And critically, the movement was visible while the market was still reacting to it – not after the reporting cycle had already closed.
What the earnings confirmed
On April 29, 2026, Etsy disclosed that total marketing spend declined from $305.9M in Q4 2025 to $174.2M in Q1 2026, representing an overall decline of approximately 41%.
Part of the reported decline reflected a reporting change related to Depop, which was no longer included in Etsy’s continuing operations. Adjusting for that change, Etsy’s core marketplace marketing spend declined by approximately 35%.
PolarisAI’s projection of a 38% decline before the earnings release lands directly between the reported total and marketplace-adjusted figures. Interestingly, it also correctly identified the directional movement of spend throughout the observed period.
Across the test period, PolarisAI achieved a 76% overall correlation with reported spend outcomes while maintaining 100% directional accuracy.

Marketing spend as an early signal
Marketing spend is often one of the first and most flexible levers companies adjust when pressure starts building.
Campaigns can be paused immediately. Acquisition budgets can tighten overnight. But the downstream impact on revenue, growth, and earnings may not become visible for weeks or even months.
That timing gap matters.
By the time the market hears the story on an earnings call, the underlying behavior has often already changed. The signal appears long before the explanation does.

Competitive intelligence has to catch up
Once, campaign cycles moved slower, budgets were adjusted less aggressively, and competitive shifts took longer to materialize across the market. The gap between market movement and financial reporting simply mattered less.
That is no longer the case.
Today, digital advertising markets can reprice competitive pressure almost in real time. A few weeks of softer acquisition activity, reduced bidding pressure, or pullback in spend can reshape an entire category long before earnings reports catch up.
Yet most competitive analysis still happens retrospectively, after the market has already adjusted around the outcome.
Increasingly, the challenge is no longer understanding what happened. It is understanding what is changing before everyone else sees it.
Why the Etsy case became an early indicator

Unlike traditional brand advertisers, Etsy operates in a highly performance-driven environment where changes in acquisition behavior become visible very quickly across the advertising ecosystem.
That’s what made the signal so interesting. It isn’t that Etsy reduced spend. It’s that the shift was visible before the earnings narrative existed publicly.
In fast-moving advertising markets, competitive pressure changes long before quarterly reporting catches up. The companies that can detect those movements early gain a very different view of the market than the companies waiting for earnings headlines to explain what already happened.
That’s where competitive intelligence becomes most valuable, not as a historical reporting layer, but as a way to identify market shifts while they are still unfolding.
Data sources: Etsy, Inc. Q4 2025 10-K (filed February 19, 2026); Etsy, Inc. Q1 2026 10-Q (filed April 29, 2026). All figures in USD millions unless noted. PolarisAI Engine™ predictions are based on pre-earnings signal data and are not investment advice.
Latest Articles
-
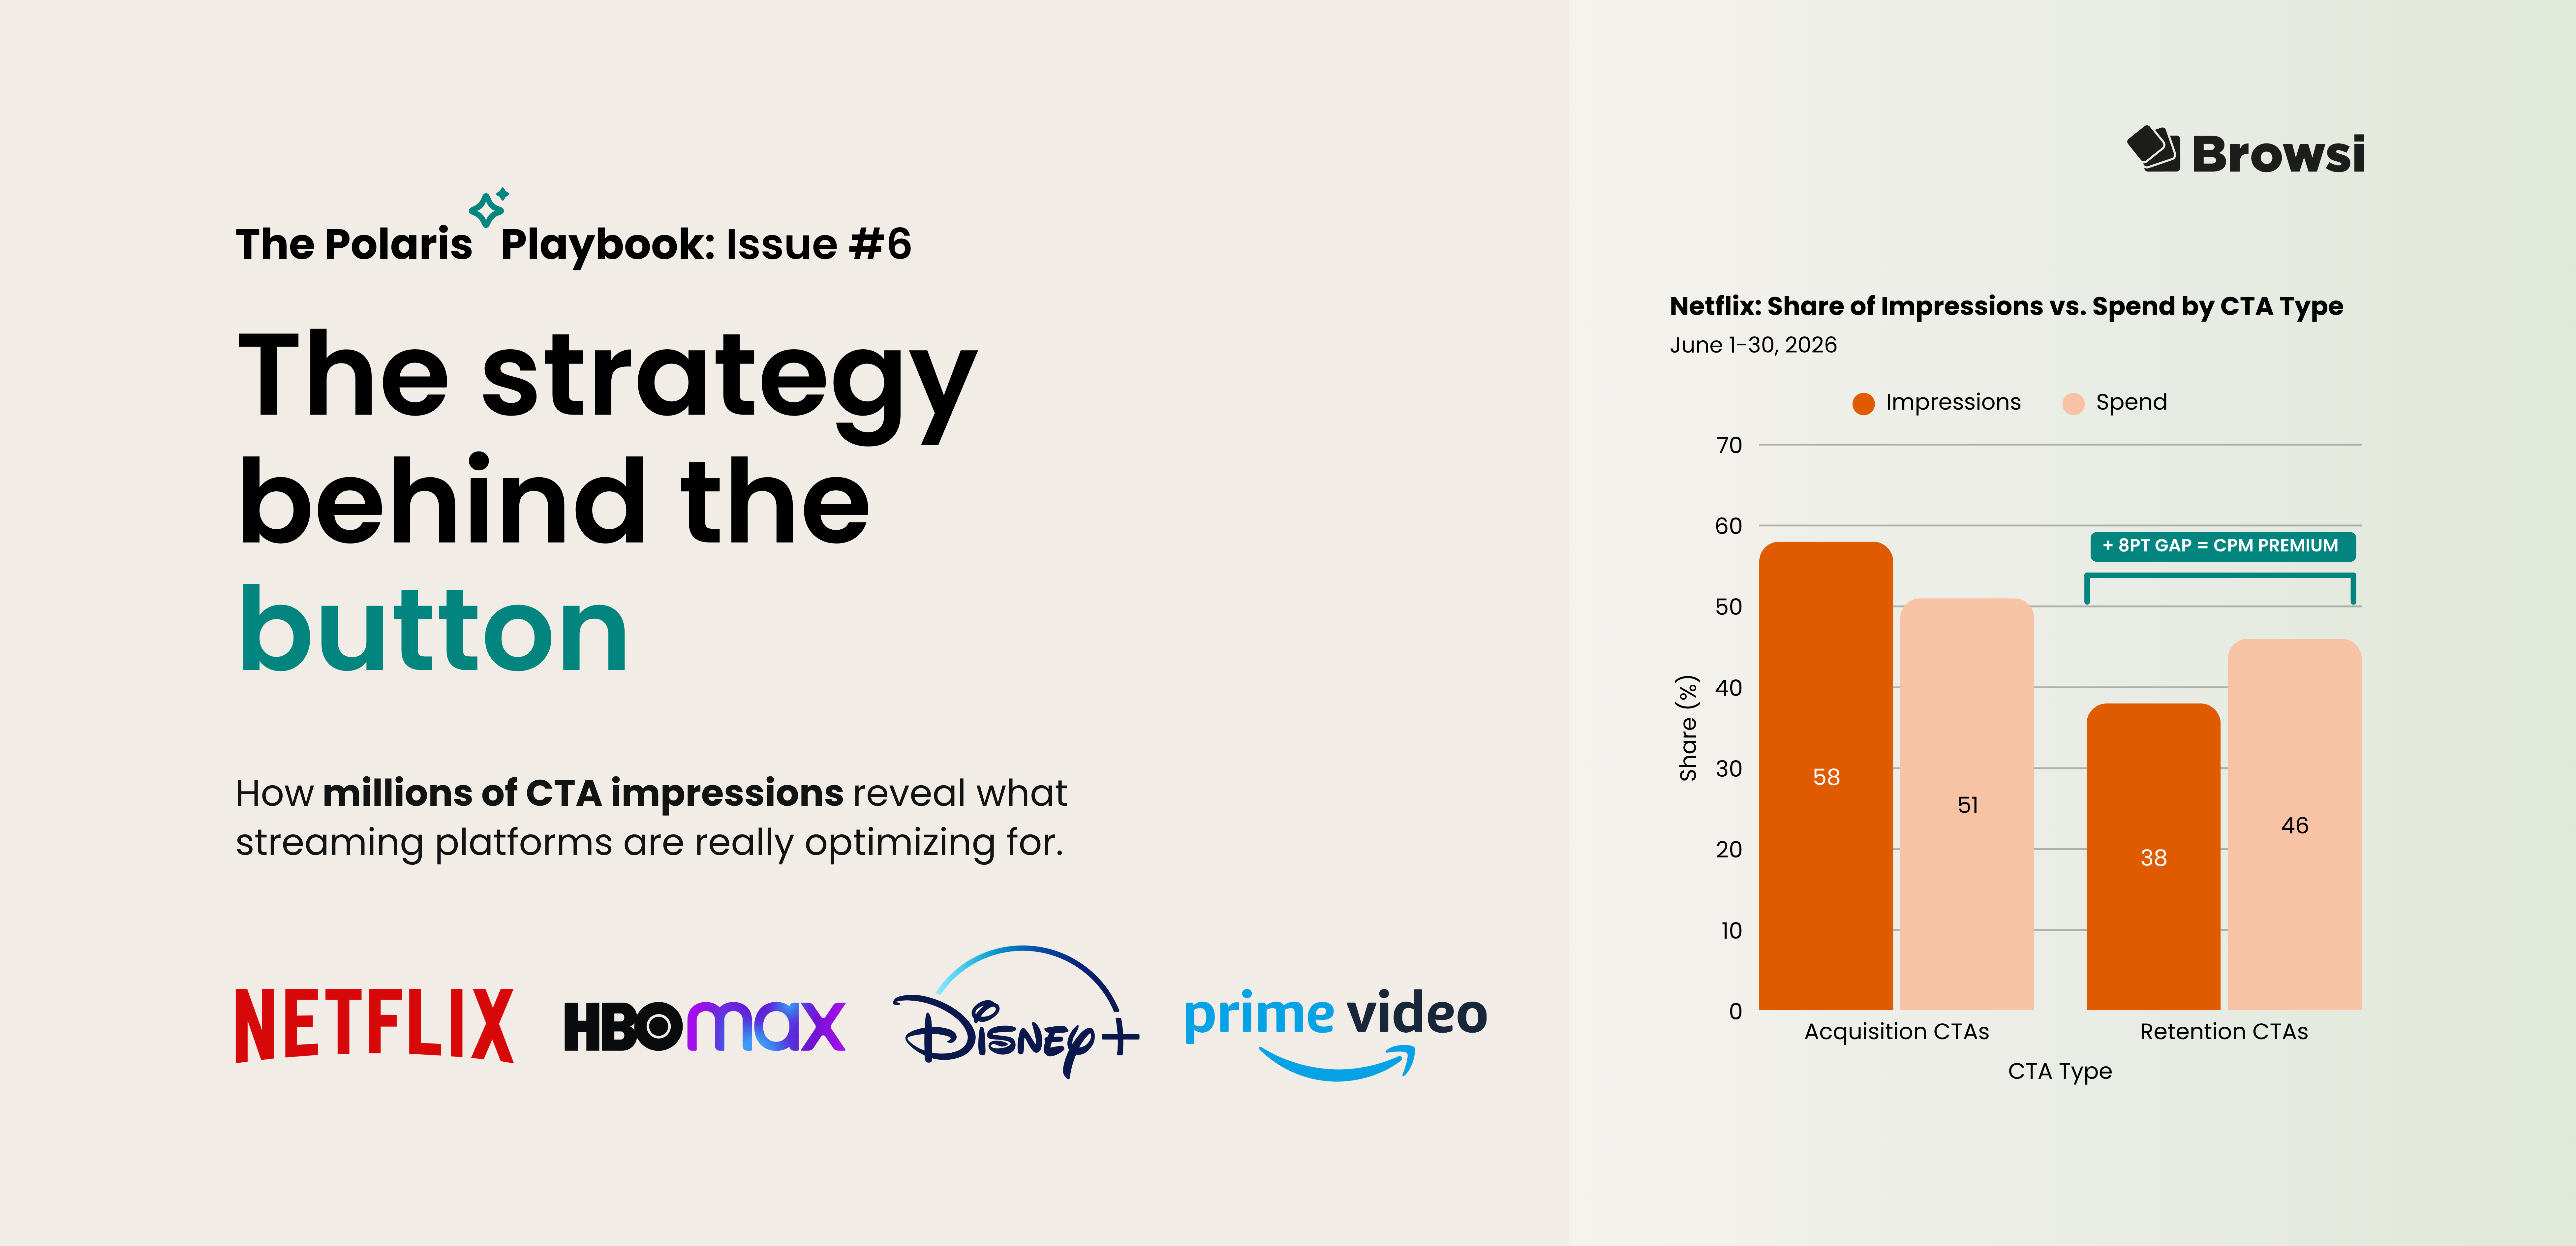
The strategy behind the button: What millions of CTA impressions reveal about competitive strategy
What can a single CTA button reveal about a company's marketing strategy? By analyzing millions of Meta ad impressions, PolarisAI uncovers how Netflix, Prime Video, HBO Max, and Disney+ use "Sign Up," "Watch More," and other CTAs to prioritize subscriber acquisition, viewer engagement, and broader competitive strategy.
View Now -

The 6-step framework for turning signals into strategy
Competitive intelligence only matters if it leads to action. In this edition of The Polaris Playbook, we use Honda and five competitors to demonstrate a practical six-step framework for turning competitive signals into strategic recommendations marketers can actually use.
View Now -

How Accurate is Browsi’s Data? Tried and Tested.
Most marketers trust competitive spend data without questioning where the numbers come from. We tested PolarisAI Engine™ against the only benchmark that matters: what advertisers actually reported in their earnings calls. The result was an 87% correlation across five major brands, revealing the difference between data that looks confident and data grounded in reality.
View Now