Insurance is Boring. Their Social Spend Isn’t.
By Asaf Shamly | May 21, 2026
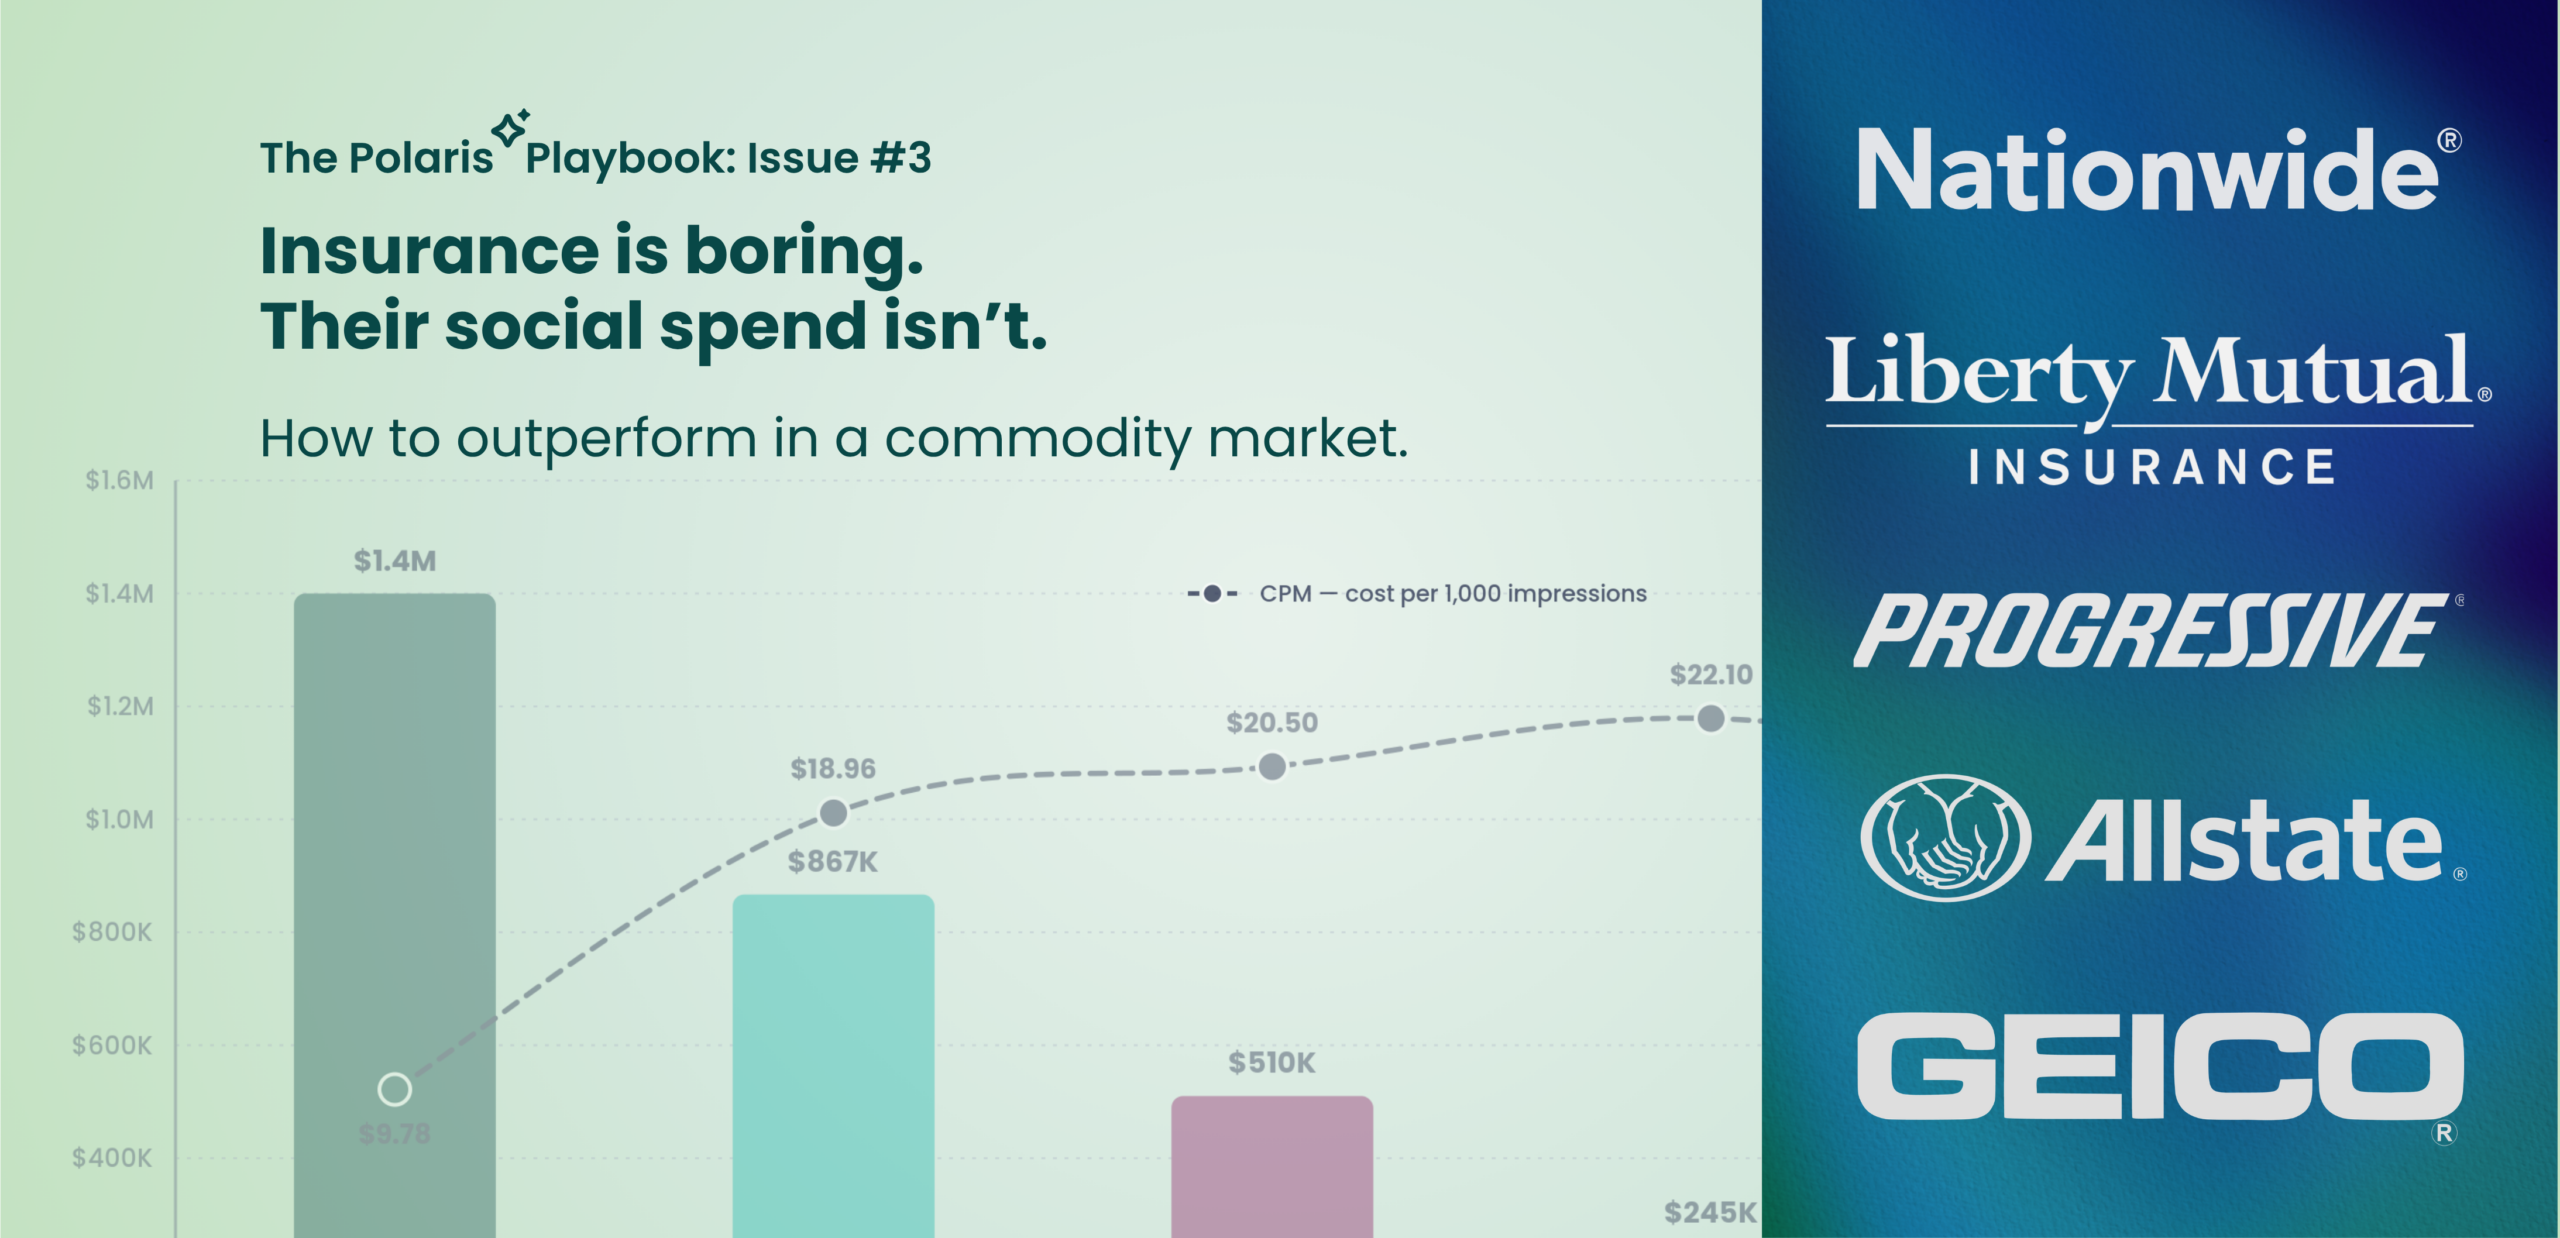
How to outperform in a commodity market.
Personal insurance is not a category where brands win through product differentiation. Whether it’s auto, home, renters, or commercial coverage, the claim experience is largely the same, regardless of whose logo is on the letterhead.
The implication is that the only real battlefield is attentionand whoever can buy attention most efficiently, most relentlessly, and most intelligently tends to win. That’s what makes the social data from the past 30 days so interesting.
In today’s Playbook issue, we look at how six of the largest insurance brands in America — Progressive Insurance, GEICO, Allstate, Liberty Mutual Insurance, and Nationwide — allocate their Meta social dollars in real time, and what it reveals about the broader strategic bets each company is making across the market.
Let’s dive in.
2024… The year everything changed
2024 was the year insurance came back to advertising with a vengeance.
After two years of aggressive pullbacks driven by runaway claims inflation and catastrophic underwriting losses, the major carriers found their footing on pricing and unleashed their marketing budgets simultaneously.
Still, the brands came back very differently.

In 2024, Progressivewent from $1.22 billion in advertising spend in 2023 to nearly $3.5 billion. That’s not a budget increase – that’s a strategic blitz.
Their CEO was explicit about the rationale: if competitors were slow to re-rate policies after the inflation shock of 2022–23, they were to flood the market with advertising, while competitors were still busy absorbing losses.
The result was a temporary profitability window that Progressive used aggressively.

What the social data shows today
When we analyzed the April 14–May 12 period on PolarisAI Engine™ across the six major insurance brands, one pattern immediately stood out.

GEICO, Allstate, Liberty Mutual, and Nationwideall cluster within the expected insurance CPM range of roughly $18–22.
Then there’s Progressive. Despite being the largest spender in the group by a significant margin, Progressive also records the lowest CPM in the dataset at just $9.78. That combination is unusual.
In most competitive ad auctions, scale alone does not typically produce a 50% pricing advantage over peers operating in the same category. Yet Progressive’s CPM sits roughly 52% below the competitive average. At nearly $1.4 million in Meta spend per day, that efficiency compounds quickly, translating into substantially more impressions for the same budget relative to competitors.
The result is that Progressive is not simply buying more attention than the market. It appears to be buying attention far more efficiently than the rest of the category.
The social data is the only place this shows up.
The efficiency playbook (and why it’s invisible without the right tools)

Progressive hasn’t publicly disclosed the specifics of its Meta buying strategy, so what follows is the most plausible inference from the available data.
One explanation appears in the channel distribution data itself. PolarisAI shows that Progressive allocates a meaningfully larger share of its Meta budget toward Messenger and Threads – placements that typically carry lower CPMs than Facebook or Instagram Feed because they attract less auction pressure from performance advertisers.
The rest comes from audience precision. Meta’s auction rewards relevance. Ads that generate stronger engagement signals are typically cheaper to distribute because Meta’s algorithm prioritizes content users are more likely to interact with.
That means advertisers with better audience intelligence often gain a pricing advantage inside the auction itself.
And Progressive? Well, they possess one of the largest proprietary consumer datasets in the insurance industry. Its Snapshot telematics program alone collects behavioral driving data from millions of users.
While none of this has been externally confirmed by Progressive, the pricing gap itself is very real, and inferable, with the right tools.
Two camps. One category.

The data reveals a clean strategic divide inside the insurance category.
– On one side: the digital-native acquirers, brands that treat Meta social as a performance engine for policy acquisition.
– On the other: the legacy brand advertisers, whose identity is still rooted in television and agent networks, in which digital is a supplement rather than a foundation.
GEICO’s positioning in the data makes this divide especially interesting. Despite spending significantly less than Progressive overall, GEICO allocates a larger share of its media budget to Meta than any other brand in the group. That suggests GEICO is treating Meta less like a supporting awareness channel and more like a core acquisition engine.
After sharply reducing advertising spend during 2022–23 to restore profitability, GEICO now appears to be rebuilding through concentrated digital investment – a strategic shift visible in the social data long before it fully appears in analyst commentary.
The same edge, across every channel

A skeptic could reasonably ask whether Progressive’s Meta CPM advantage is simply a social-platform anomaly. The open web data suggests otherwise.
Polaris AI’s programmatic intelligence module shows that Progressive also dominates the same competitive set across display advertising, capturing 69% share of voice and 68% of all impressions delivered.
That matters because it suggests Progressive’s advantage is not platform-specific. The same efficiency pattern appears across both Meta social and open web programmatic at nearly the same magnitude. In other words, this does not look like a single-channel optimization tactic. It looks like a broader media-buying system.
The attention metrics tell a second story.
Despite exceptionally low CPMs, Progressive’s TruAttention™ and CTR scores both trail the category average significantly. That’s the signature of a brand optimized aggressively for scale and acquisition efficiency over engagement depth – a trade-off that makes sense for high-volume direct-response growth, but one that leaves measurable quality on the table.
What PolarisAI sees that no other tool can
Annual advertising budgets are public. Earnings calls describe strategy in broad strokes. Press releases announce campaigns.
But none of them tell you what’s actually happening inside the auction on a given Tuesday, or whether a competitor’s efficiency advantage on one channel reflects a broader system operating across all of their media buying.
Progressive’s CPM advantage – 52% lower on Meta social and 69% lower on open web programmatic – does not appear in earnings reports, SEC filings, or traditional competitive intelligence tools. It only becomes visible when you can observe channel-level pricing and allocation data in real time, across platforms.
That is the specific intelligence Polaris AI is designed to surface.
The takeaway
Progressive is the largest spender in the category. That part is public. What isn’t public is that they’re also the most efficient.
That combination doesn’t happen by accident. It’s a system. And it’s been running across every channel, largely invisible to the brands competing against it.
GEICO is building a different version of the same edge, quietly shifting its comeback through concentrated digital allocation while legacy brands are still treating social as a supporting act.
The intelligence gap in this category isn’t about budget. It’s about visibility.
The brands that can see inside the auction in real time, across channels, aren’t just better informed. They’re making structurally different decisions than the ones who can’t.
That’s what the social data reveals. And it’s the only place it shows up.
If you want to see what this looks like in your category, try PolarisAI Engine™ for free.
Latest Articles
-
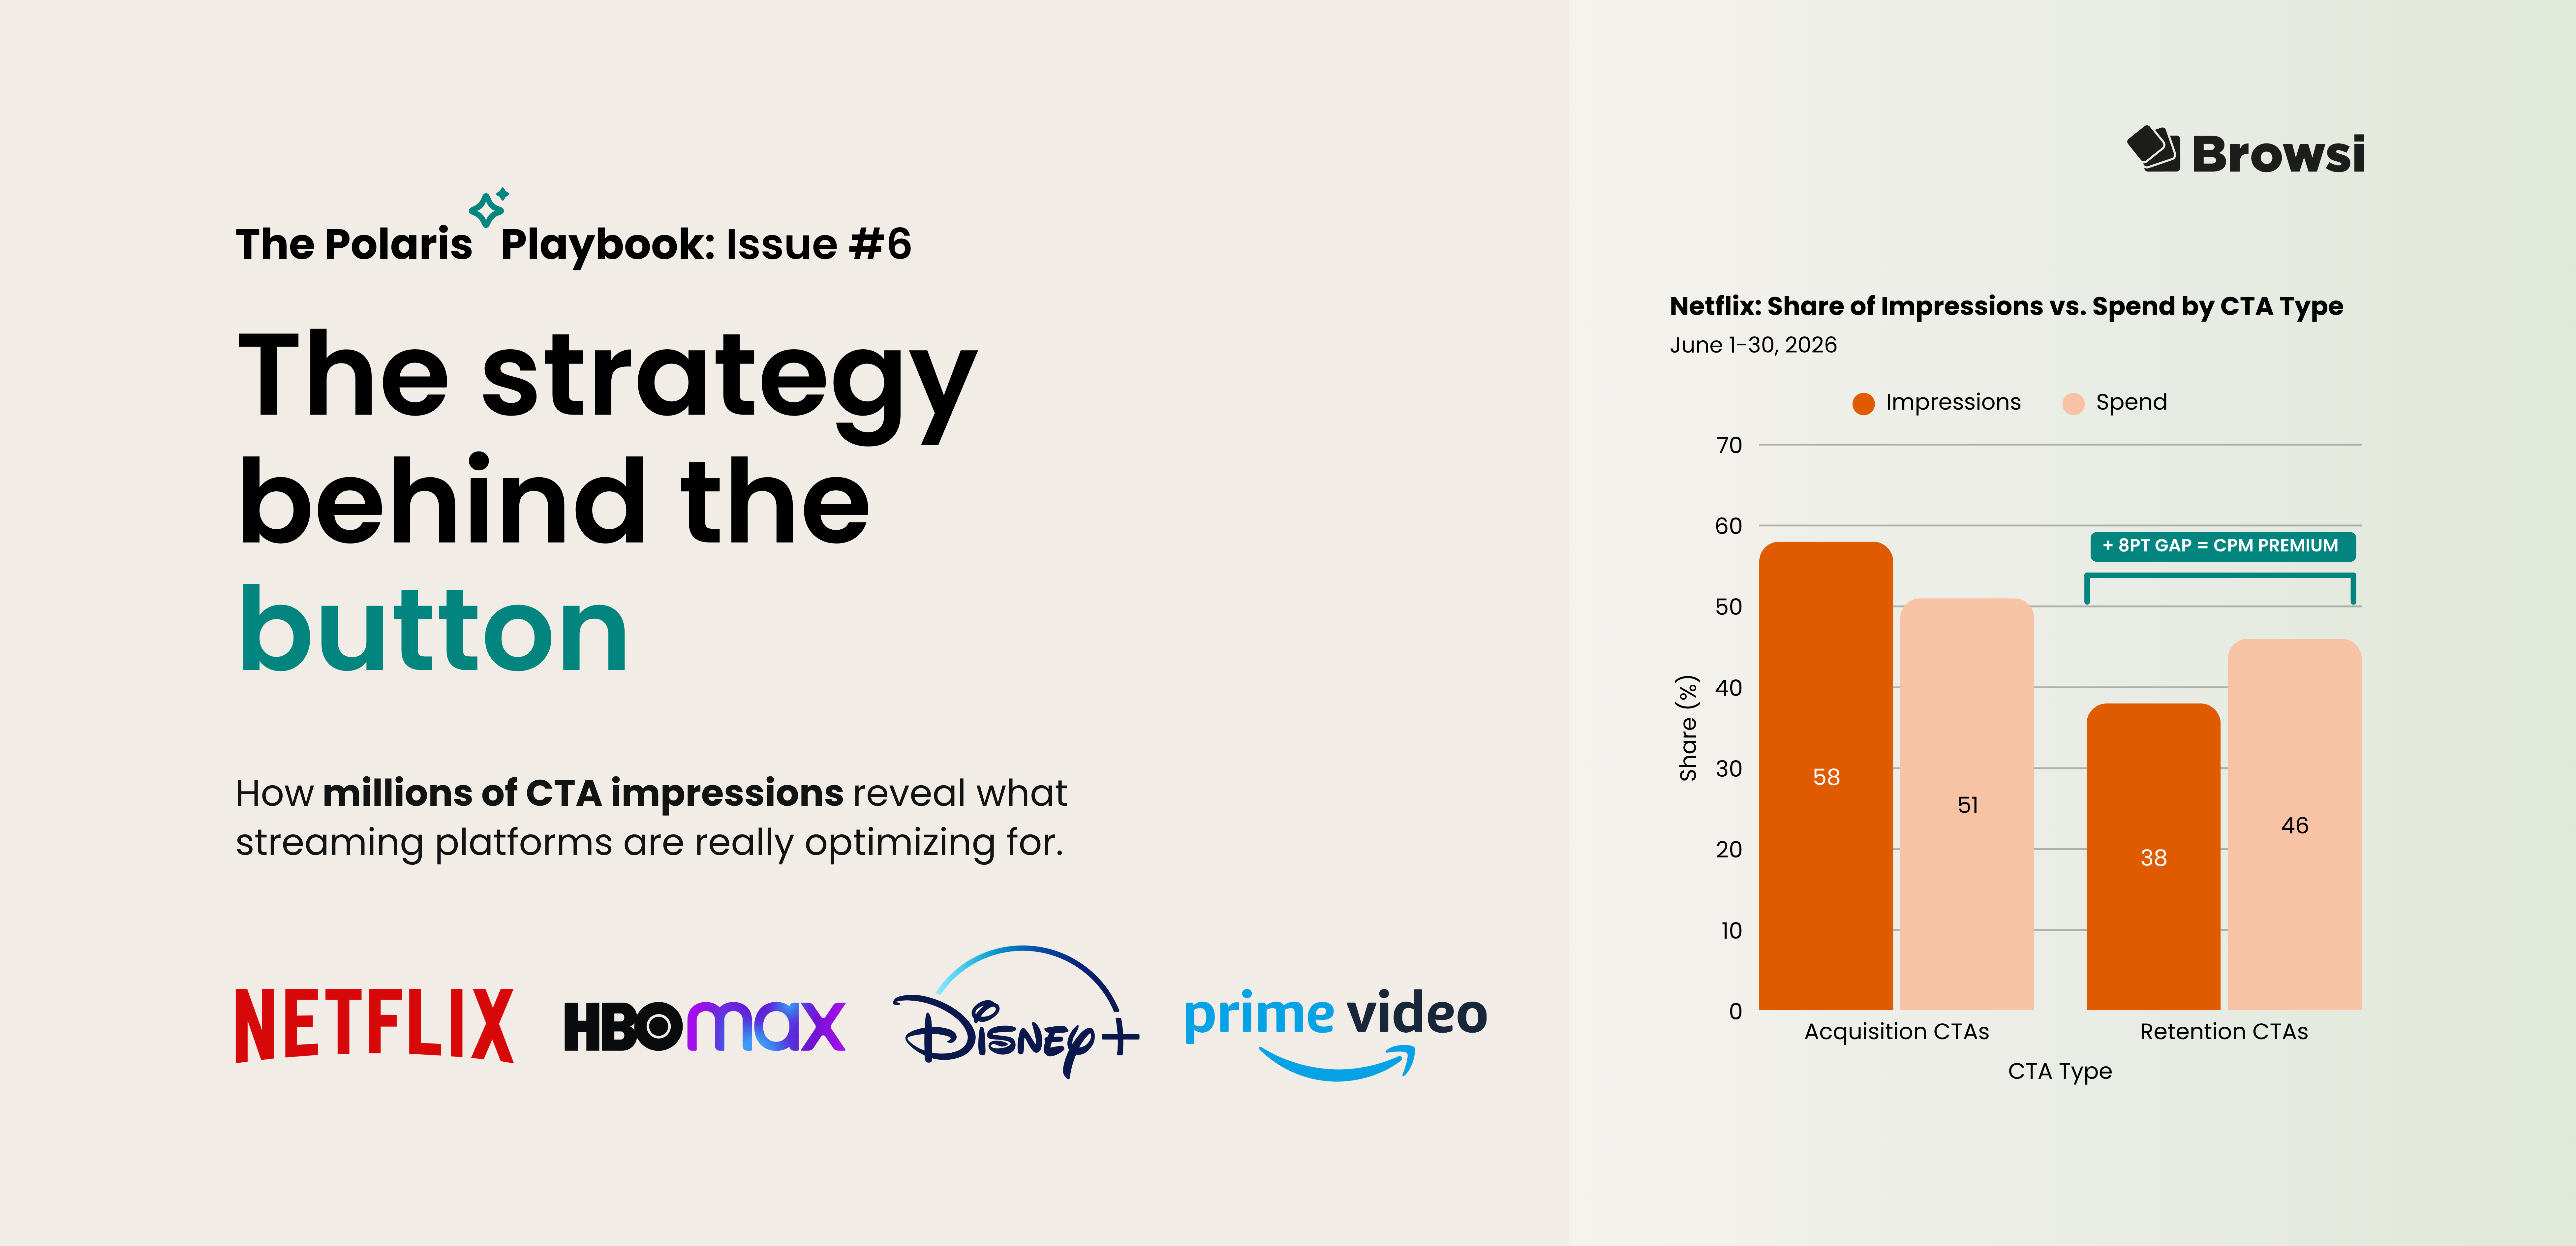
The strategy behind the button: What millions of CTA impressions reveal about competitive strategy
What can a single CTA button reveal about a company's marketing strategy? By analyzing millions of Meta ad impressions, PolarisAI uncovers how Netflix, Prime Video, HBO Max, and Disney+ use "Sign Up," "Watch More," and other CTAs to prioritize subscriber acquisition, viewer engagement, and broader competitive strategy.
View Now -
The 6-step framework for turning signals into strategy
Competitive intelligence only matters if it leads to action. In this edition of The Polaris Playbook, we use Honda and five competitors to demonstrate a practical six-step framework for turning competitive signals into strategic recommendations marketers can actually use.
View Now -
How to Detect Advertiser Spend Drops Before They Hit
Etsy's earnings confirmed what PolarisAI had already seen: a major pullback in marketing investment. By analyzing competitive signals before quarterly results were released, PolarisAI projected a 38% decline in spend while the market was still reacting to the underlying changes. The result highlights a growing reality for marketers: the most valuable competitive insights often emerge long before earnings calls explain them.
View Now